FIGURE 5.
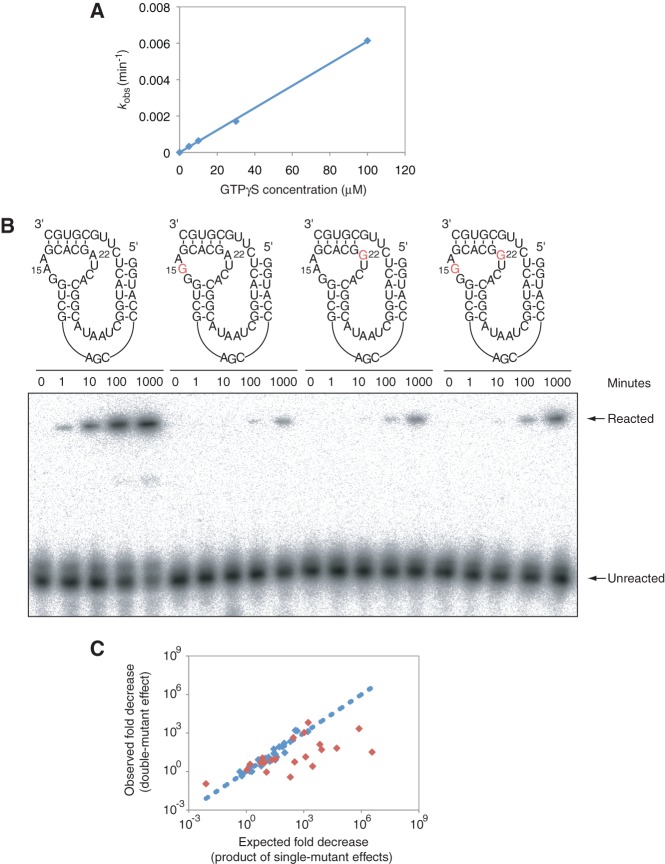
Testing whether correlations indicate functionally coupled nucleotides. (A) Plot of observed rates of the reference ribozyme as a function of substrate concentration, showing that 30 µM GTPγS is below saturation for this construct. (B) APM polyacrylamide gel showing the effects of the 15A to 15G, 22A to 22G, and 15A-22A to 15G-22G mutations. Mutational effects at these positions were strongly coupled, with a D value of 170 in the mutational background used here. Reactions were performed in ribozyme selection buffer, in the presence of 1 µM ribozyme and 30 µM GTPγS. (C) The relationship between the product of the two single-mutant effects (x-axis) and the double-mutant effect (y-axis) for the 13 most strongly correlated pairs of positions (red diamonds; mutual information significance values ≤ 0.01) and 16 less strongly correlated pairs (blue diamonds; mutual information significance values > 0.01). The line indicates the expected relationship if the product of two single-mutant effects always equaled the double-mutant effect. Sequences and relative efficiencies of mutants used to calculate these D values are given in Supplemental Table 2.

