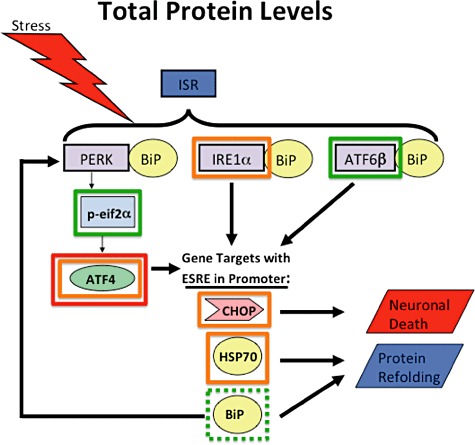
Figure 11.

Diagram summarizing results of total protein levels for each protein examined. For ISR proteins outlined with green boxes, we observed increased protein levels. Specifically, for ATF6 and peIF2α we saw increases in both HAND and HIV(+) tissue compared with respective control groups when compared via IFA. When compared via immunoblot, ATF6 increased in HAND tissue over NcN tissue when compared via immunoblot, while peIF2α increased in HIV(+) tissue when compared with HIV(−) tissue. BiP (outlined in a dashed green box) was analysed previously [52] and increased via IFA and immunoblot. For proteins outlines with orange boxes, we saw no change. Specifically, IRE1α, CHOP and HSP70 showed no change across groups by immunoblot. ATF4 showed no change across groups by immunoblot, and showed no change in HIV(+) tissue over HIV(−) tissue via IFA. ATF is also outlined with a red box indicating that its levels decreased in HAND tissue compared with neurocognitively normal tissue via IFA.
