
Figure 9.
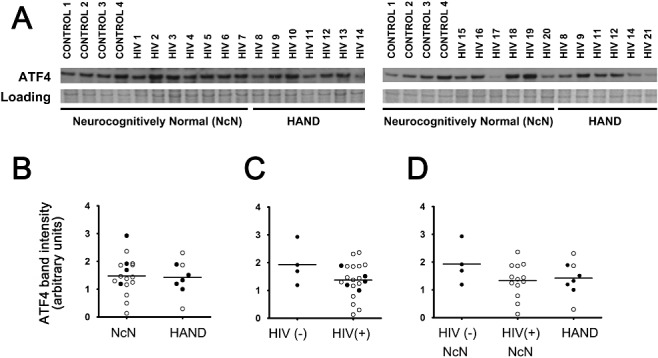
ATF4 levels do not change across experimental groups when examined via immunoblot analysis. Whole‐cell protein extracts were isolated from fresh‐frozen cortical autopsy tissue and were used for assessment of ATF4 protein levels. (A) Blots showing ATF4 levels in autopsy tissue, as well as a band from Coomassie staining of the PVDF membrane: HIV(−)/neurocognitively normal (control), HIV(+)/neurocognitively normal, and HAND. (B) ATF4 expression does not change in the mid‐frontal cortices of HAND cases (n = 8) compared with neurocognitively normal (NcN) cases (n = 17). Samples were run on two separate blots due to large number of sample sizes. Quantification was conducted as described for ATF6α in the Figure 3 legend. For cases run on both gels, normalized values were averaged and are represented using closed circles. Cases run on only one gel are represented using open circles. (C) ATF4 levels did not significantly change in HIV(+) (n = 21) tissue compared with HIV(−) (control) tissue (n = 4). (D) Cases were divided into three groups: (i) HIV(−)/neurocognitively normal; (ii) HIV(+)/neurocognitively normal; and (iii) HAND. Groups were compared using one‐way anova and no significant differences were found. Coomassie staining of the PVDF membrane was used as a loading control for normalization of protein levels for quantification and statistical analysis as shown in B–D. Student's t‐test for two‐way comparisons and one‐way anova for three‐way comparisons and Mann–Whitney U post‐hoc analysis.