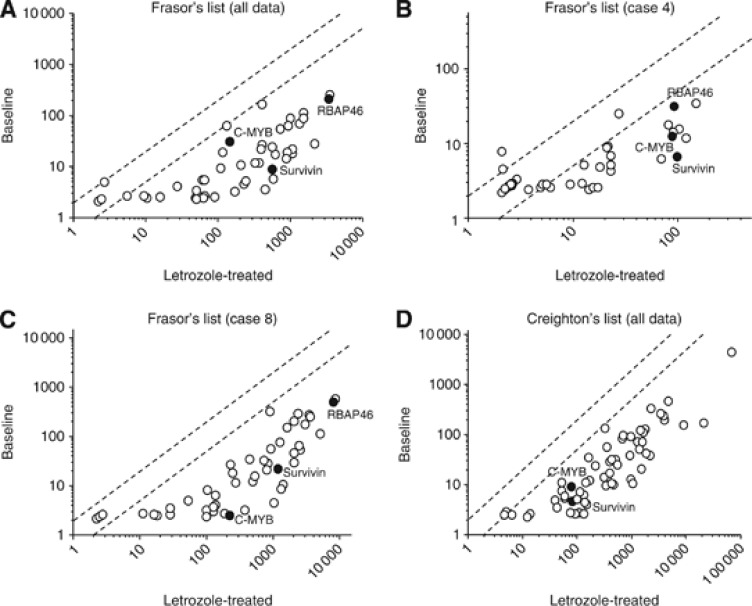
Figure 2.
Scatter plot analysis of microarray data of estrogen-induced genes listed by Frasor et al (2003) (A–C) and Creighton et al (2006) (D). Genes with an expression ratio, post-treatment to baseline, of >2.0 or <0.5 are located outside the diagonal dotted line. A and D summarise all the values (baseline group; n=2, and post-treatment group; n=5), while (B) and (C) showed the paired data obtained from Case 4 and Case 8, respectively. Locations of estrogen-induced genes, for which immunohistochemistry was performed (i.e., RBAP46, C-MYB and survivin), were noted as closed circles.

