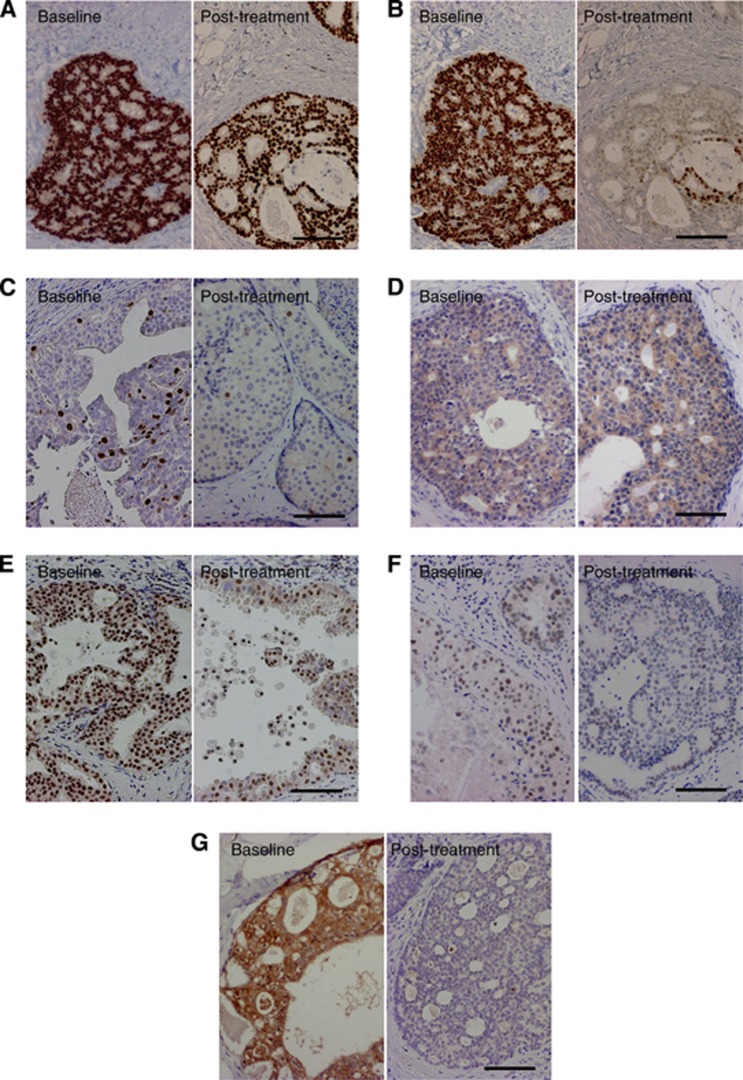
Figure 5.
Immunohistochemistry for ER (A), PR (B), Ki-67 (C), aromatase (D), RBAP46 (E), C-MYB (F) and survivin (G) in DCIS at baseline (left panel) and corresponding post-treatment tissues (right panel). Left panels of (A) and (B), and right panels of (A) and (B) were of the same area, respectively. Bar=100 μm, respectively.

