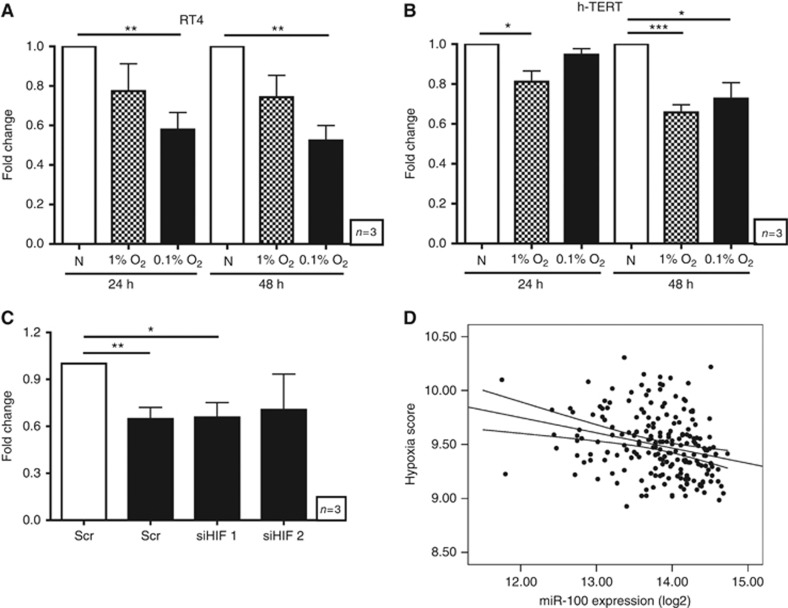
Figure 3.
Relationship between miR-100 expression and hypoxia. (A and B) Expression of miR-100 in (A) RT4 and (B) h-TERT cells exposed to normoxia (white bars), 1% O2 (hatched bars) or 0.1% O2 (black bars) for the indicated time. (C) Expression of miR-100 in RT4 cells cultured in normoxia (white bar) or 0.1% O2 (black bars) for 24 h after transfection with scramble (Scr) siRNA or siRNA against HIF-1α or HIF-2α. (D) Correlation of miR-100 expression with the hypoxia score of 219 primary breast cancer samples. (A–C) Data are mean and s.e.m. of three independent experiments. *P<0.05, **P<0.01, ***P<0.001.

