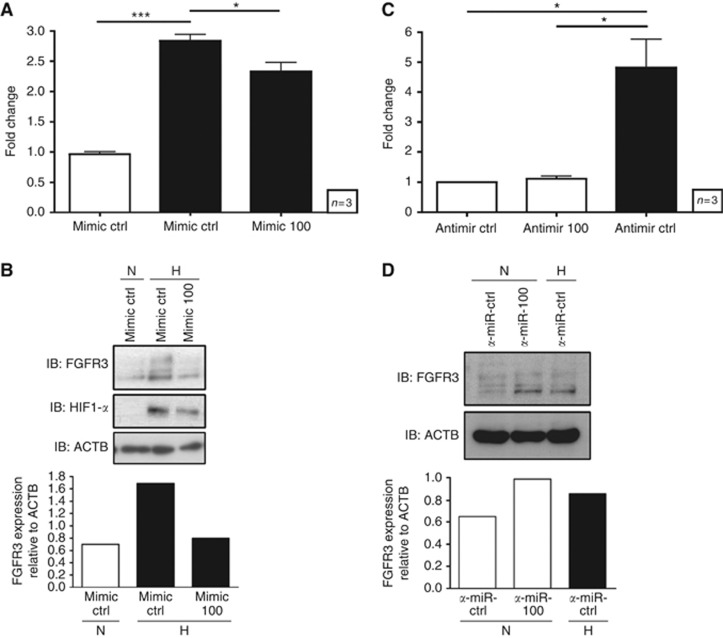
Figure 4.
Regulation of FGFR3 by miR-100. (A) FGFR3 mRNA expression was examined in RT4 cells transfected with a miRNA control mimic or mimic-100 and exposed to normoxia (white bar) or 0.1% O2 (black bars) for 24 h. (B) FGFR3 protein expression was examined in RT4 cells transfected with a miRNA control mimic or mimic-100, and exposed to normoxia (N) or 0.1% O2 (H) for 24 h. Quantification of a representative western blot is shown. (C) FGFR3 mRNA expression was examined in RT4 cells transfected with a control miRNA inhibitor (anti-miR-ctrl) or miR-100 inhibitor (anti-miR-100), and exposed to normoxia (white bars) or 0.1% O2 (black bar) for 24 h. (D) FGFR3 protein expression was examined in RT4 cells transfected with a control miRNA inhibitor (anti-miR-ctrl) or miR-100 inhibitor (anti-miR-100), and exposed to normoxia or 0.1% O2 (H) for 24 h. Quantification of a representative western blot is shown. (A and C) Data are mean and s.e.m. of three independent experiments, (B and D) data are representative of at least two independent experiments. *P<0.05, **P<0.01, ***P<0.001.

