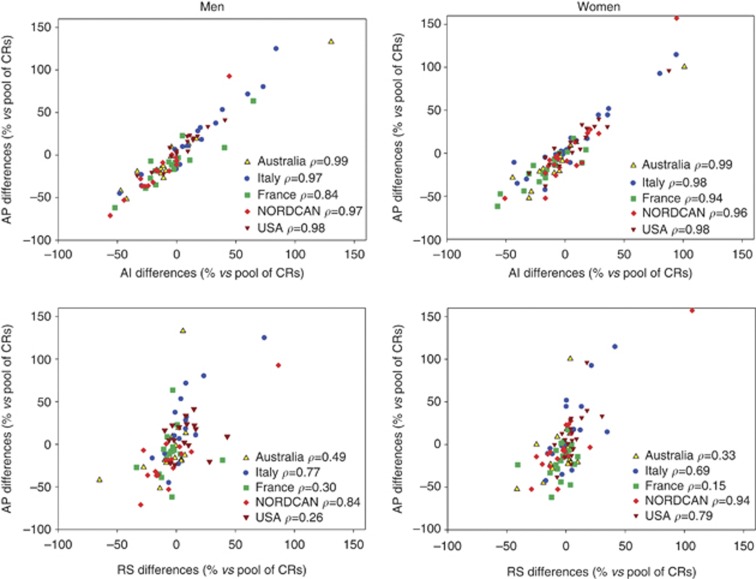
Figure 1.
Distribution of differences (vs Pooled average of the selected cancer registries) of age-standardised prevalence (AP)a, age-standardised incidence rates (AI)a, and 5-year relative survival (RS)b of major cancer sitesc in selected countries and Pearson's correlations (ρ)d. Each dot represents one cancer site.aStandardised on European population; bStandardised on the International Cancer Survival Standards; cCancer sites or types presented in Tables 2 and 3; dWeighted for the incidence of the specific cancer site or type.

