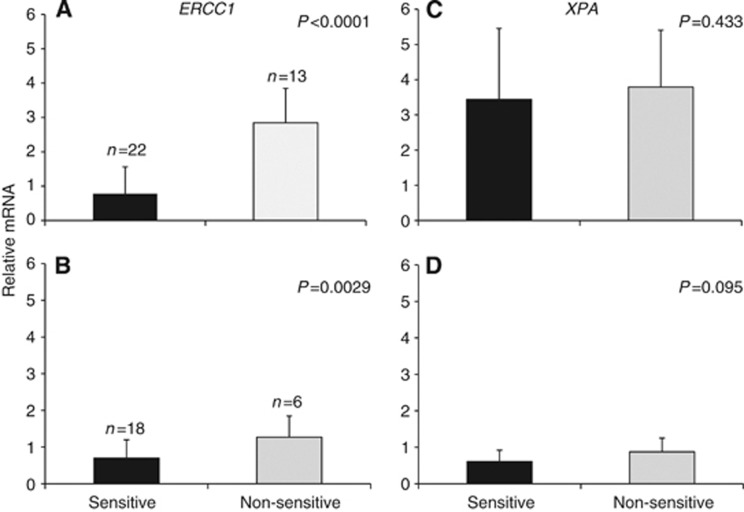
Figure 3.
The expression of ERCC1 and XPA in Mexican and Peruvian patients with ns-TGCTs. (A) The relative quantification of ERCC1 mRNA in cisplatin sensitive and non-sensitive ns-TGCTs in the Mexican population. P-values were obtained with Student's t-test. (B) The relative quantification of ERCC1 mRNA in CPS and non-CPS ns-TGCTs in the Peruvian population. (C) The relative quantification of XPA mRNA in CPS and non-CPS ns-TGCTs in the Mexican population. (D) The relative quantification of XPA mRNA in CPS and non-CPS ns-TGCTs in the Peruvian population. P-values were obtained with Student's t-test.

