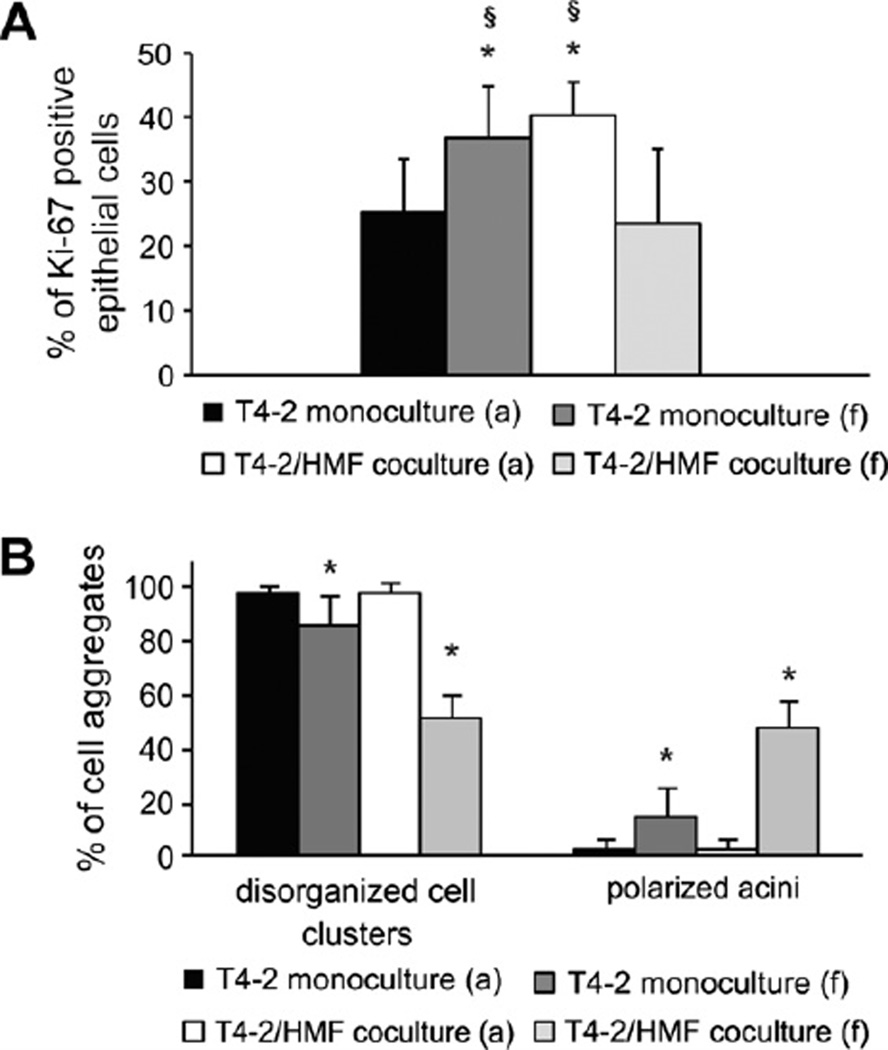
Fig. 8.
Proliferation and acinar morphogenesis of T4-2 cells in floating 3D-collagen I gels. (A) Ki67-proliferation index of T4-2 cells at day 8 in attached and floating mono- and cocultures was calculated by counting Ki-67 positive epithelial cells in at least 12 visual fields of each gel (inverted microscope; magnification 630×). The Ki67 proliferation index is the ratio of Ki-67 positive nuclei and all nuclei present in a visual field. Asterisk indicates statistical significance compared to attached monoculture (p < 0.01); Section sign indicates statistical significance compared to floating coculture (p < 0.01). (B) T4-2 cells were cultured as mono- and cocultures with HMF in floating and attached gels for days 7 days and morphology of cell clusters was evaluated (abbreviations: a, attached gel; f, floating gel). Asterisk indicates statistical significance compared to attached monoculture (p < 0.05).

