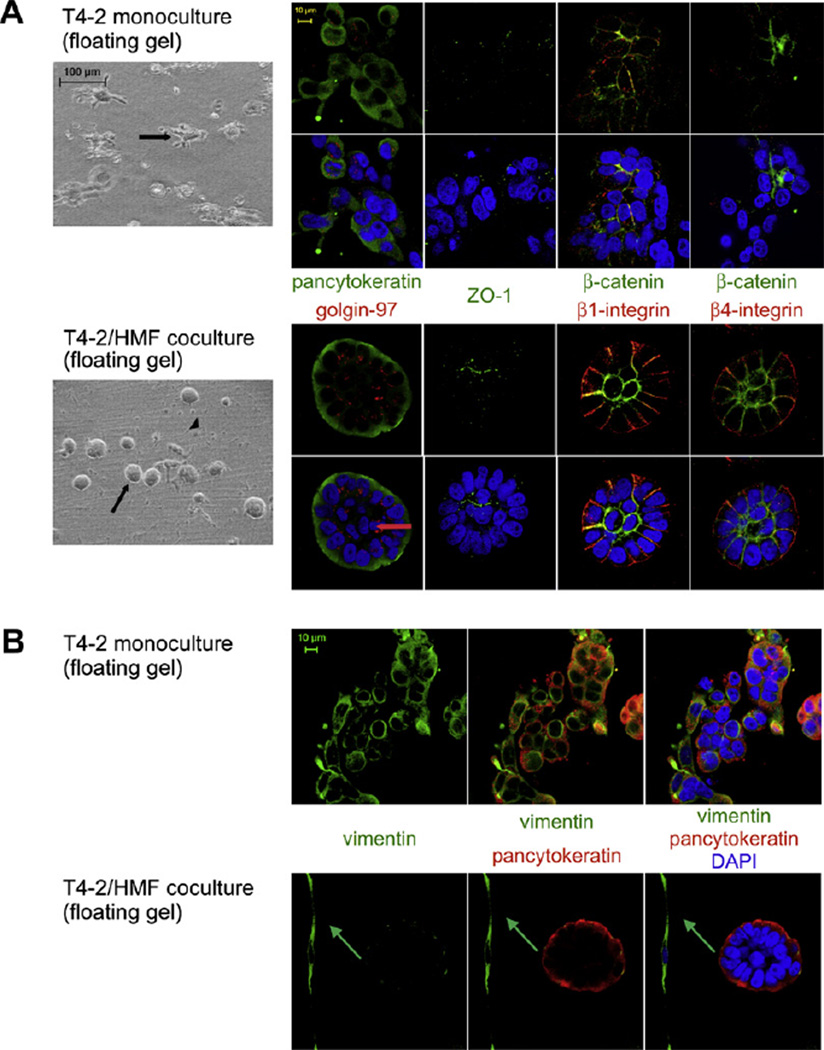
Fig. 9.
Morphology of breast carcinoma cells in floating 3D-collagen I gels. (A) T4–2 cells (arrow) in monoculture (upper panel) compared with T4–2 cells in coculture (lower panel) with HMF (arrowhead) as shown by phasecontrast microscopy (column 1) and immunoflourescence staining (columns 2–5). Cells were stained for apical (golgin-97 (red)) and ZO-1 (green)), basal (4-integrin (red)), basolateral (1-integrin (red)) and lateral (-catenin (green)) polarity markers and epithelial (pancytoceratin (green)) markers. Nuclear counterstain (DAPI (blue)). Red arrow: Lumina of acini containing single cells indicating that the process of lumen formation has not been completed. (B) Vimentin expression is strongly reduced in polarized acini in coculture (lower panel) compared to disorganized cell clusters in monoculture (upper panel). Epithelial marker pancytokeratin (red). Nuclear counterstain (DAPI (blue)). Green arrow: Vimentin positive fibroblast in coculture.

