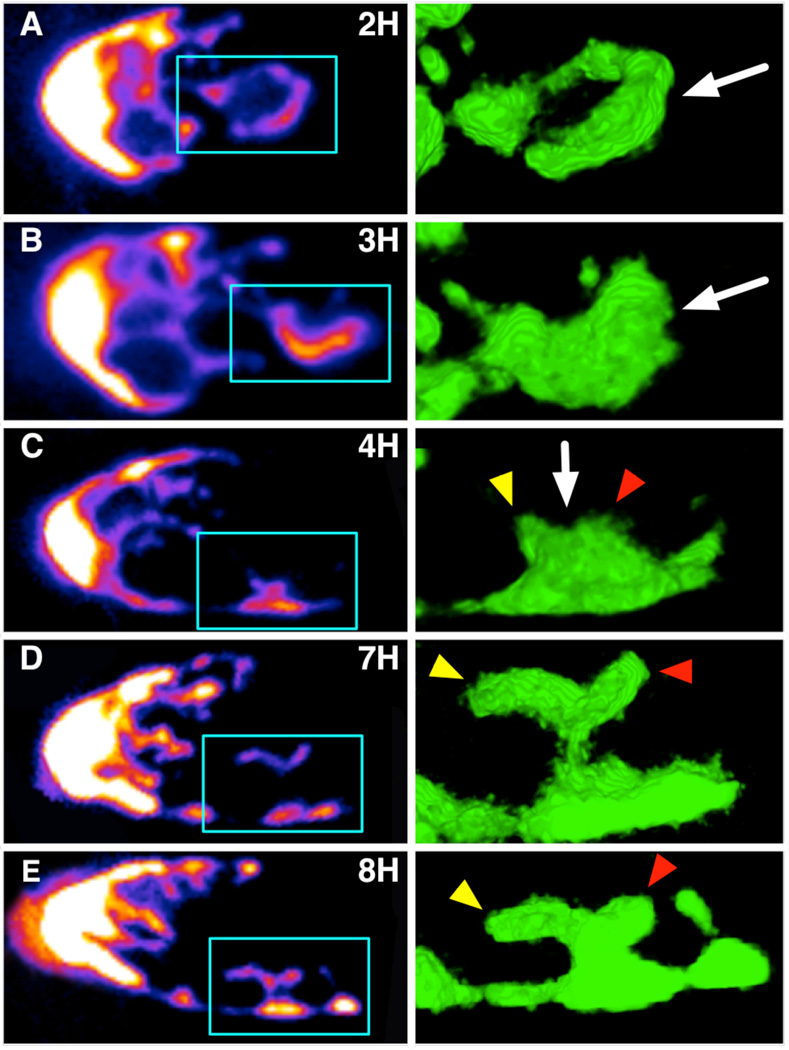
Figure 7.
Time lapse imaging of DTC processes shows an active growth and infiltration of the mitotic region (left: confocal section; right: ray tracing rendering of region boxed on left). Two important features emerge. First, some processes extend proximally by forming a transient ring-like structure (arrow on row A) that subsequently regains a linear topology (arrow on row B). Second, some processes form a bulb-like structure (arrow on row C) that changes shape over time and results in distal and thus “backward” growth of an extension (yellow arrow heads in C–E). Such extensions appear to tightly intercalate between germ cells. Another extension shows more limited growth (red arrowheads). Confocal stacks of each time point in this dataset are available in the Electronic Supplementary Information.

