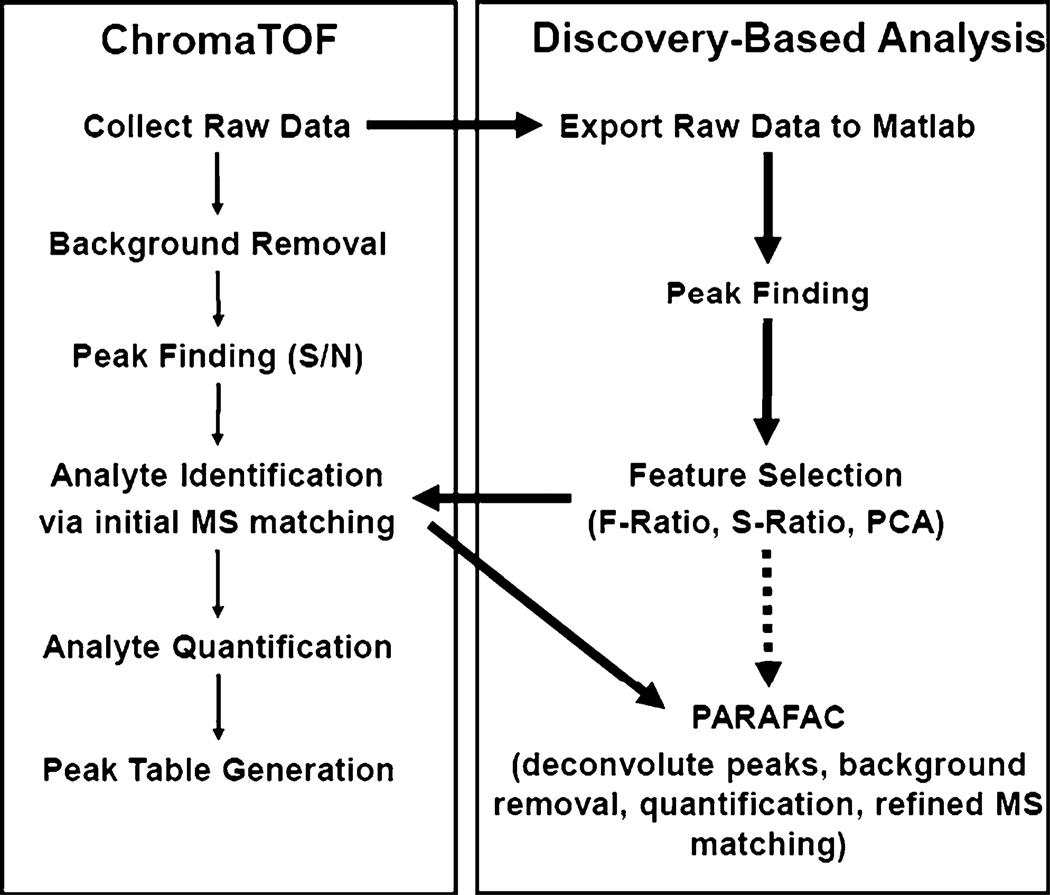
Fig. 1.
Data analysis flow chart for GC×GC data. The discovery-based data analysis approach utilizes ChromaTOF and Matlab to locate, identify, and quantify class distinguishing compounds. The traditional ChromaTOF approach (thin arrows) follows the path on the left while the discovery-based approach (thick arrows) applied herein follows the path on the right incorporating some elements of ChromaTOF data processing. The discovery-based approach could also be done in a nontargeted way as is demonstrated with the dotted arrow

