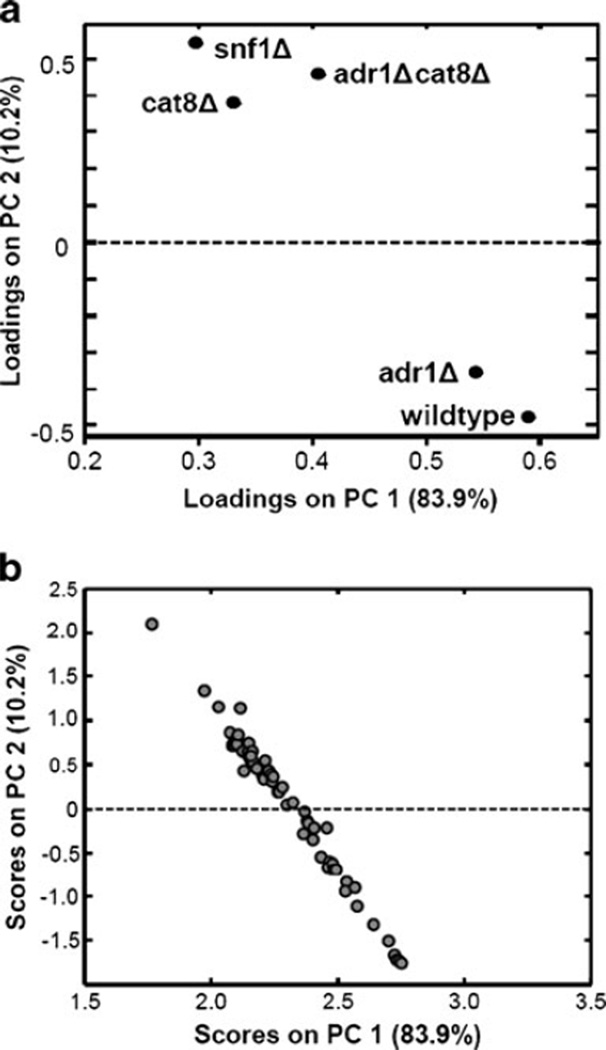
Fig. 3.
PCA of metabolites and strains. PCA was employed as a data classification tool. When mean-centered metabolites are loaded as samples, the loadings (a) provide information on which strains are most similar to each other, in the context of the analyzed metabolites. The scores (b) provide information on which metabolites are similar to each other, in the context of these strains. The metabolite levels spread out in the PC space based on the various trends, which can be seen in Table 2

