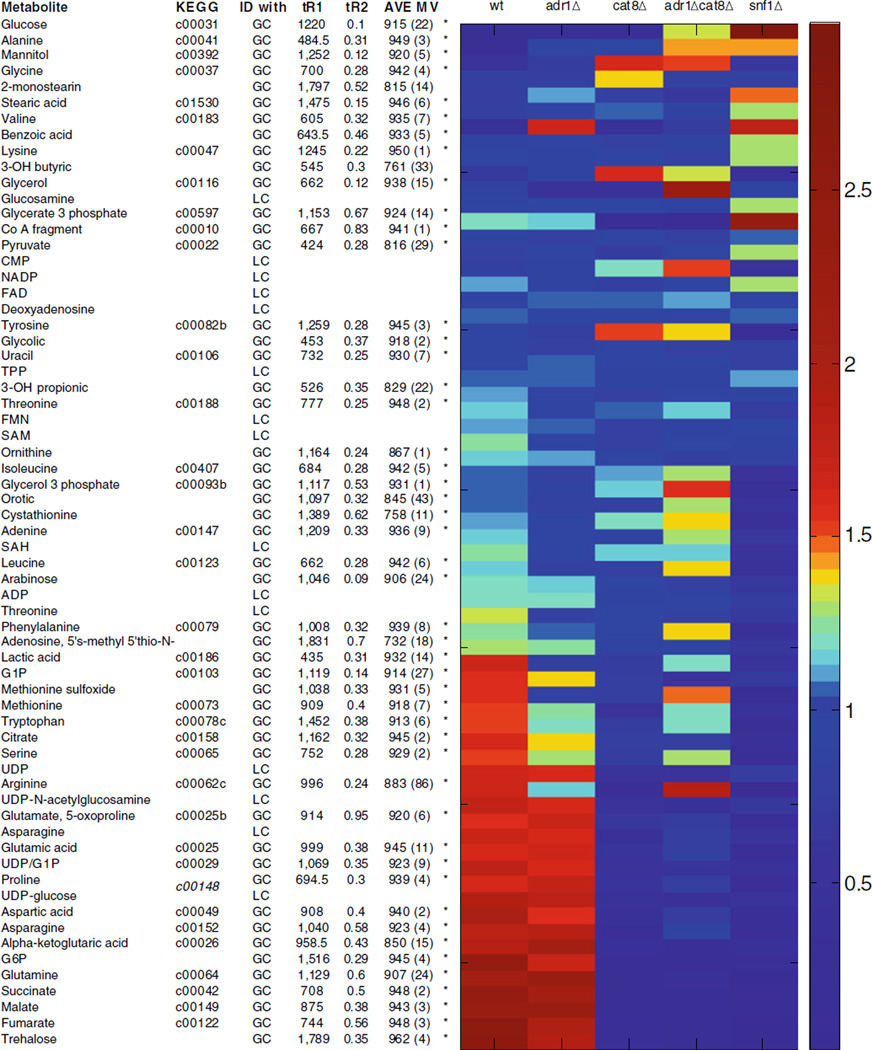
Table 2.
The 65 detected metabolites (63 unique) are sorted by score on PC1 (as shown in Fig. 2)
 |
The PCA captured patterns are evident in the relative amounts normalized to the mean for each strain. Retention time (tR1 and tR2, noted with an asterisk if matched to standard) and match values (with standard deviation in parenthesis) are provided for analytes identified with GC. ADP adenosine diphosphate, CMP cytidine monophosphate, FAD flavin adenine dinucleotide, FMN flavin mononucleotide, G1P glucose-1-phosphate, G6P glucose-6-phosphate, NADP nicotinamide adenine dinucleotide phosphate, SAH S-adenosyl homocysteine, SAM S-adenosyl methionine, TPP thiamine pyrophosphate, UDP uridine diphosphate
