Fig. 2.
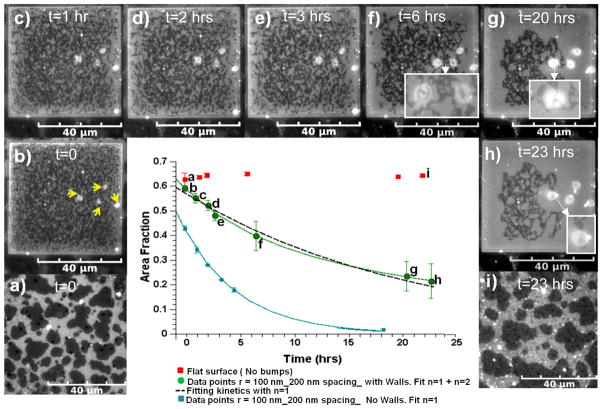
Fluorescence microscopy images showing that the area fraction of the dark Lo phase supported by the walled 200 nm lattice pattern decreased over time in comparison to the Lo phase on the unpatterned sections of PMMA. a and i) Lo-Ld coexisting phases on unpatterned PMMA at t = 0 and t = 23 hrs respectively. b–h) Vesicles (yellow arrows) grow accompanying the loss of Lo phase area fraction supported by walled lattice pattern. Insets in f–h show 5 that the vesicles are transparent to the underlying pixilation pattern. The centre graph shows the area fraction vs. time data (green circles) fit to equation (1) by the green line, and a first order fit (dAf/dt = −kAf) by the dashed line. The blue data points correspond to area fraction vs. time data for the same underlying lattice pattern without walls and a first order fit, blue line, from our previous work21 reproduced by permission of The Royal Society of Chemistry (RSC)

