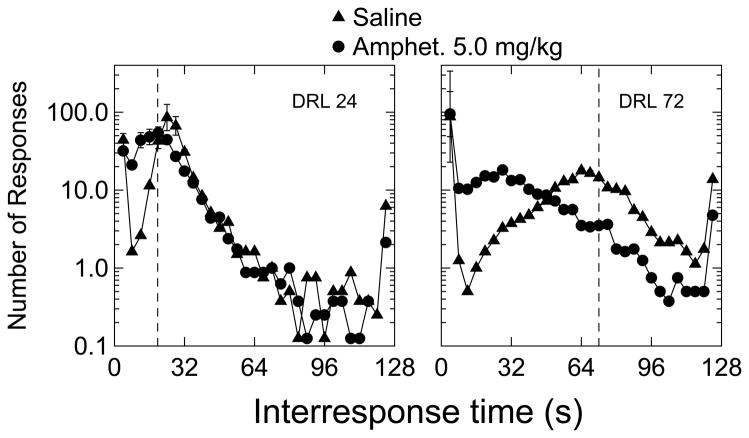
Figure 2.
Group mean of the interresponse time distributions for both DRL groups after saline or amphetamine treatment. Data are for IRT’s greater than 2.0 s (i.e., the majority of “burst responses” were eliminated). The bin size for these plots was 4 s. In each panel, the dashed vertical line marks the DRL requirement. Note that the ordinate is expressed as a log10 scale. The right-most data point in each frequency distribution depicts IRTs greater than 124 s. Brackets represent +/− 1 SEM. These data are for the entire 4 hr of both saline and amphetamine conditions.

