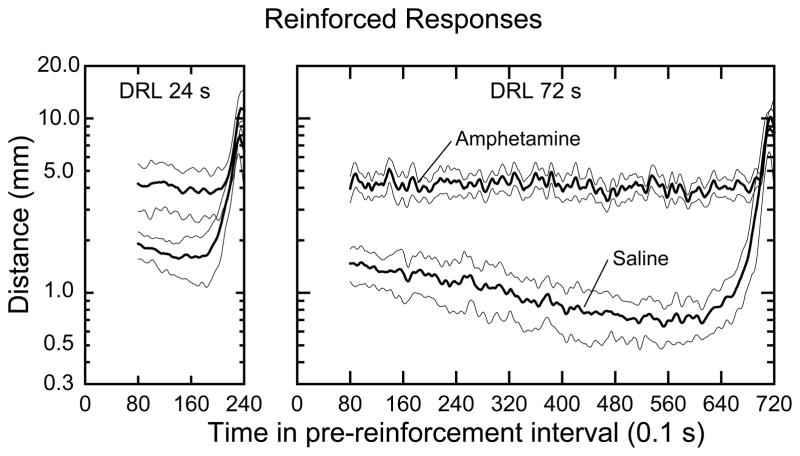
Figure 4.
Group mean amount of locomotion (thick lines) as a function of time in the pre-reinforcer interval for the indicated DRL and drug conditions. Thin lines paralleling the thick lines are the 95% confidence intervals. Note that the ordinates are expressed on a log10 scale. An explanation for why the plotted data begin at 8 s instead of at 0 s is given in the text. Upon plotting, the data were subjected to a lowess smooth in order improve the visibility of the confidence intervals around the mean curves. The amount of smoothing used did not affect the breadth of the confidence intervals.

