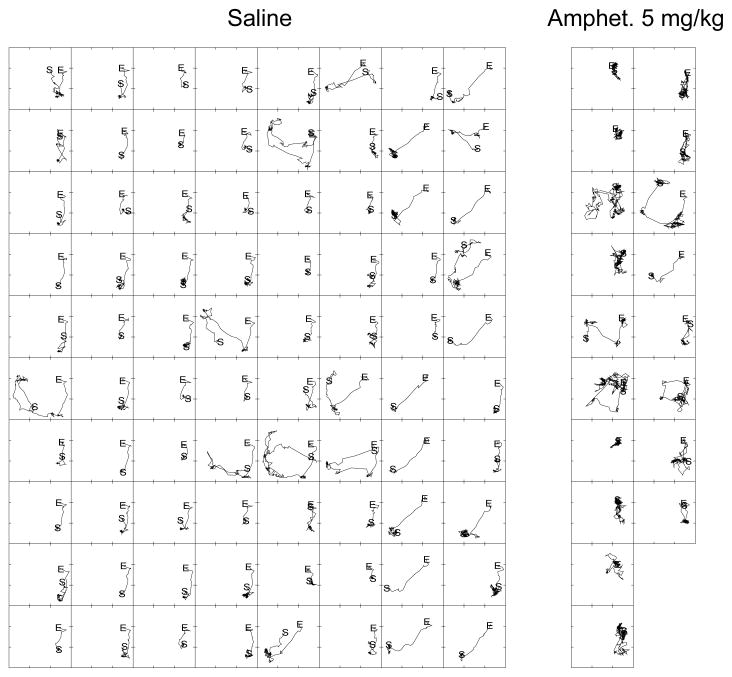
Figure 6.
Illustrative movement trajectories for one DRL-72-s-trained rat with the starting locations (“S”) and the ending locations (“E”) of a rat’s movements in the 72-s before reinforced responses. Data are for an entire session after saline or amphetamine treatment for one rat. In each grouping of plots, the 1st reinforced response is at the top left. Time advances down the ten columns of axes, jumps to the top of the next column to the right and advances down the column, and so on. The axes enclosing the tracings represent the actometer sensing area, and the upper and lower tick marks along the left border designate the approximate location of the operandum aperture and water port, respectively.

