
Figure 2.
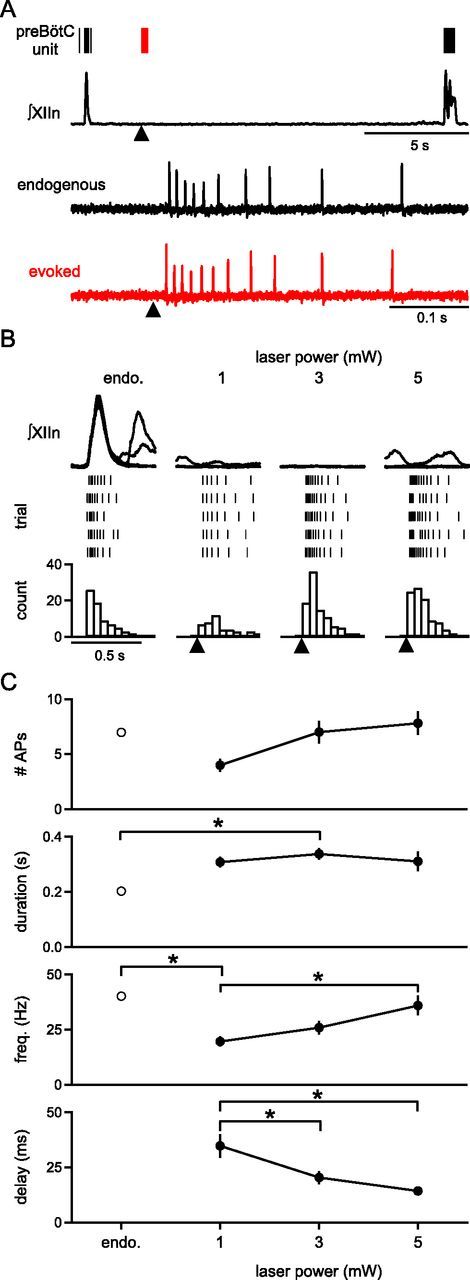
Cell-attached recordings of preBötC neuron firing patterns in response to photostimulation of the recorded neuron. A, Top, XIIn recording and representative preBötC inspiratory neuron firing pattern at baseline (endogenous burst, black raster) and in response to a 3 mW laser spot targeted to soma of recorded neuron (black triangle; red raster; 5 × 800 μs pulses, 200 Hz). Bottom, Firing patterns shown at top are expanded. Evoked firing pattern in response to laser does not exceed the frequency of firing during a normal endogenous burst. B, Simultaneous recordings of XIIn (top) and suprathreshold responses to targeted photostimulation of the recorded neuron (black triangle) as a function of laser power (5 × 800 μs pulses, 200 Hz; middle, bottom). Representative rasters of laser-evoked peristimulus spike times for 5 runs (middle) and peristimulus time histograms (bottom) are comparable to firing patterns elicited during an endogenous burst (endo.). C, Number of APs, duration of response, frequency, and time to first AP after stimulus (5 × 800 μs pulses, 200 Hz) compared to firing patterns during endogenous bursts (endo.) and as a function of laser power (AP number: one-way ANOVA, F(3,40) = 2.82, p = 0.05; duration of response: F(3,39) = 3.13, endo. vs 3 mW, p = 0.03; frequency: F(3,39) = 6.68, endo. vs 1 mW, p = 0.002, 1 mW vs 5 mW, p = 0.008; time to first AP: F(2,29) = 8.41, 1 mW vs 3 mW, p = 0.001, 1 mW vs 5 mW, p = 0.02; n = 11 neurons in 8 slices). *p < 0.05.