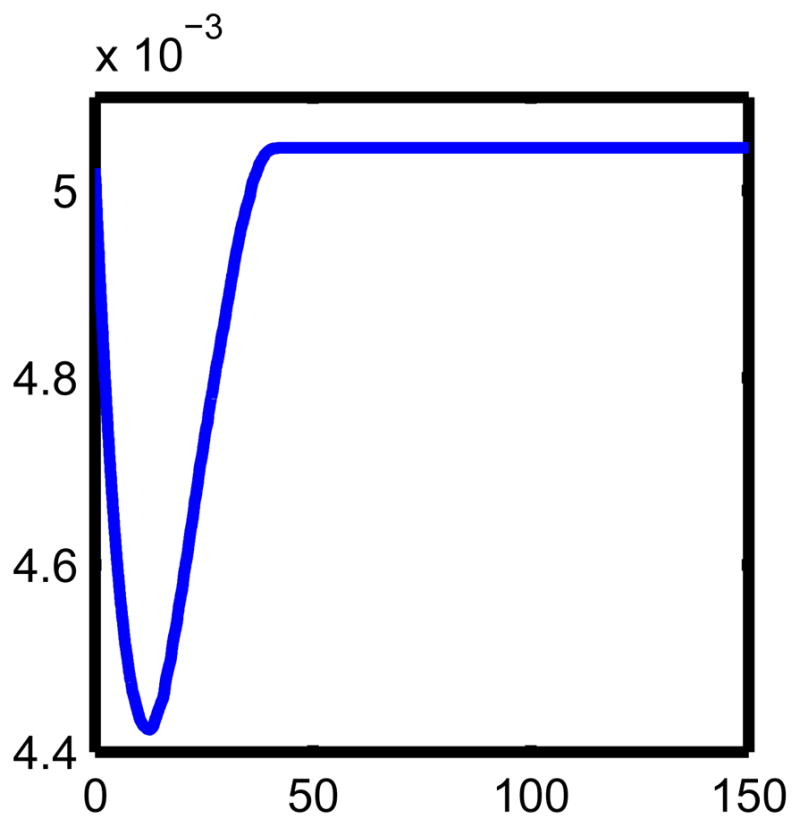
Figure 5. The amount of change due to remodeling.

The units are days for the horizontal axis and mm2 for the vertical axis. We arrived at this by computing the interior area at each time in the evolution of the interface. This can be compared with figure 1. The differences in geometry (i.e. velocity times radius squared here, and local bone mass in 1) results in a slightly faster, but qualitatively similar, cycle than in figure 1.
