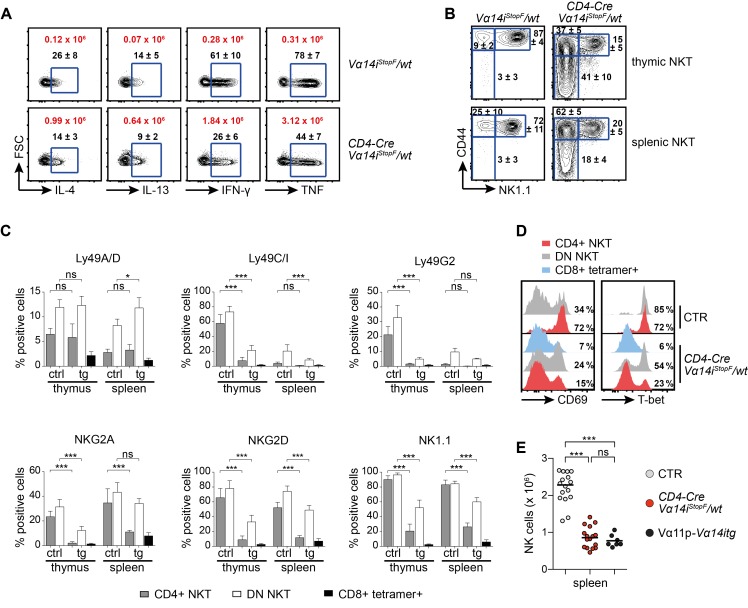
Figure 3. NKT cell overproduction affects their maturation and NK cell homeostasis.
(A) Intracellular IL-4, IL-13, IFN-γ, and TNF expression of splenic CD4+ NKT cells isolated from the depicted animals 90 min after αGalCer injection. Cells were stained directly ex vivo without addition of brefeldin or monensin. Black numbers indicate mean percentages ± SD, and red numbers indicate mean total NKT cell counts expressing the respective cytokine. Data are from three animals per genotype; FSC, forward scatter. (B) Representative proportions of stage 1 (CD44low NK1.1low), stage 2 (CD44high NK1.1low), and stage 3 (CD44high NK1.1high) thymic and splenic NKT cells. Numbers indicate mean percentages ± SD of 10 mice per genotype. (C) Flow cytometric analysis of the depicted markers on thymic and splenic, transgenic, and control NKT cells. Bars indicate means and error bars SD calculated from 4–7 mice. (D) Extracellular and intracellular flow cytometric stainings of CD69 and T-bet in the depicted NKT cell subpopulations. Numbers in representative histogram indicate percentage of CD69high or T-bet+ cells among the indicated NKT cells calculated from eight animals per genotype (CD69) or three animals per genotype (T-bet). Histograms are representative of at least three independent experiments with each at least seven mice in total. (E) Absolute splenic NK cell numbers (NK1.1+ TCRβ− tetramer–) of age-matched 6–12-wk-old animals (7–16 per genotype). Bars indicate medians. *** p<0.001; ns, not significant; one-way ANOVA. Throughout the figure, NKT cells were gated as tetramer+ TCRβ+, conventional (conv) T cells as tetramer− TCRβ+; CTR, CD4-Cre or Vα14iStopF/wt.

