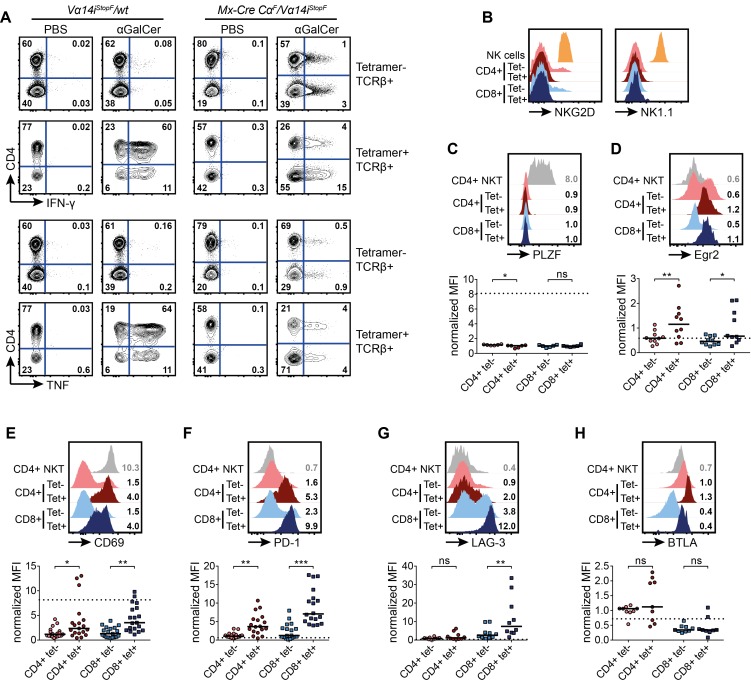
Figure 6. TCR-switched tetramer+ T cells display an activated/exhausted phenotype, but no signs of NKT cell differentiation.
T-cell-deficient mice were reconstituted with NKT-cell-depleted splenocytes of the indicated genotypes. The TCR switch was induced by poly(I:C) administration. Eight weeks later, the animals were analyzed. (A) Expression of intracellular IFN-γ or TNF ex vivo 90 min after αGalCer injection of the indicated mice. Data are representative of two independent experiments with two animals each. (B) Representative histograms of flow cytometric analyses. Surface expression of NKG2D and NK1.1 on T cells (TCRβ+) of the indicated surface phenotypes in comparison to NK cells (NKG2D+ TCRβ− CD5− or NK1.1+ TCRβ− CD5−) are shown. Histograms are representative for at least three independent experiments with at least one mouse each. (C–H) Representative histograms of flow cytometric analyses. T cells (TCRβ+) of the indicated surface phenotypes, and of wild-type splenic CD4+ NKT cells, are shown. Numbers in representative histograms indicate means of the median fluorescence intensities (MFIs), normalized to CD4+ tetramer− T cells of animals that received NKT-cell-depleted Mx-Cre CαF/wt splenocytes, 8 wk after poly(I:C) injection. Means were calculated from 6–25 mice. Scatter plots display normalized MFI. Bars indicate medians. Dotted lines indicate medians of the median fluorescence intensities of control CD4+ wild-type NKT cells calculated from 2–6 mice. (C, D) Intracellular PLZF (C) and Egr2 (D) expression. (E–H) Extracellular expression of CD69 (E), PD-1 (F), LAG-3 (G), BTLA (H); *** p<0.001; ** p<0.01; * p<0.05; ns, not significant; one-way ANOVA.

