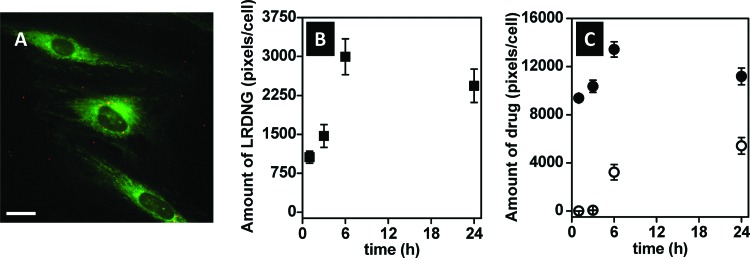
Fig. 4.
HUVEC uptake of HAF-LRDNG by epifluorescence microscopy. (a) Representative epifluorescence photomicrograph of cells after 1 h incubation with LRDNG (red) loaded with mock drug, HAF, (green), namely HAF-LRDNG. The scale bar corresponds to 10 μm. (b) Uptake of HAF-LRDNG and (c) intracellular (closed circles) and extracellular (open circles) release of mock drug HAF as a function of incubation time.

