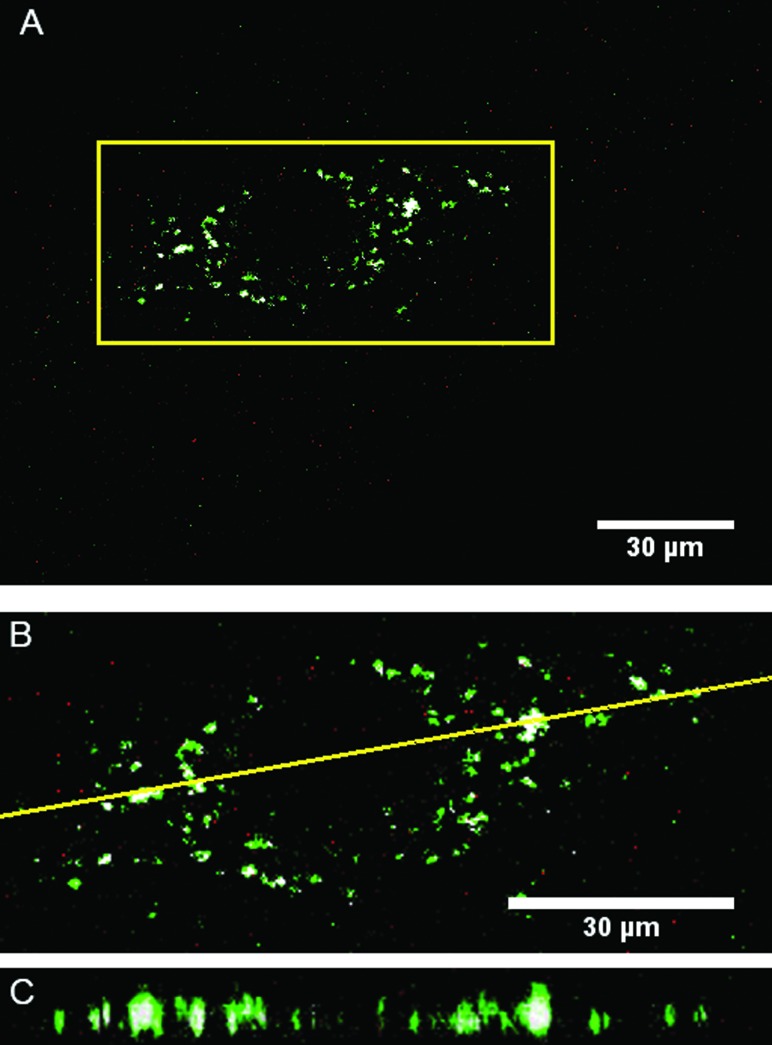
Fig. 6.
Localization of LRDNG (red) inside HUVEC after 1 h. RDNG are pseudocolored red, lysozymes are pseudocolored green, and colocalization, as determined by the Costes image analysis, is highlighted in white. (a) Single, middle confocal slice of a representative cell. (b) Zoomed in view of the region highlighted in panel A. (c) XZ rendering for the plane indicated by the yellow line in panel B.

