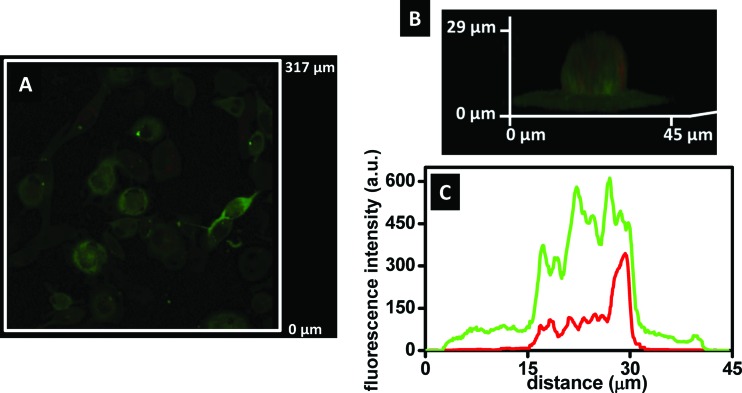
Fig. 7.
Uptake of LRDNG by PMA-stimulated, GFP-actin THP-1 cells by confocal microscopy following 24 h incubation. (a) Representative epifluorescence photomicrograph of middle slice of confocal z stacks (b) 3D image of a single cell. (c) Sum of fluorescence intensities of green (GFP-actin) and red (LRDNG) channels for all z heights (0.2 μm steps) of the 3D image, indicating LRDNG inside the cell body and not on the surface.

