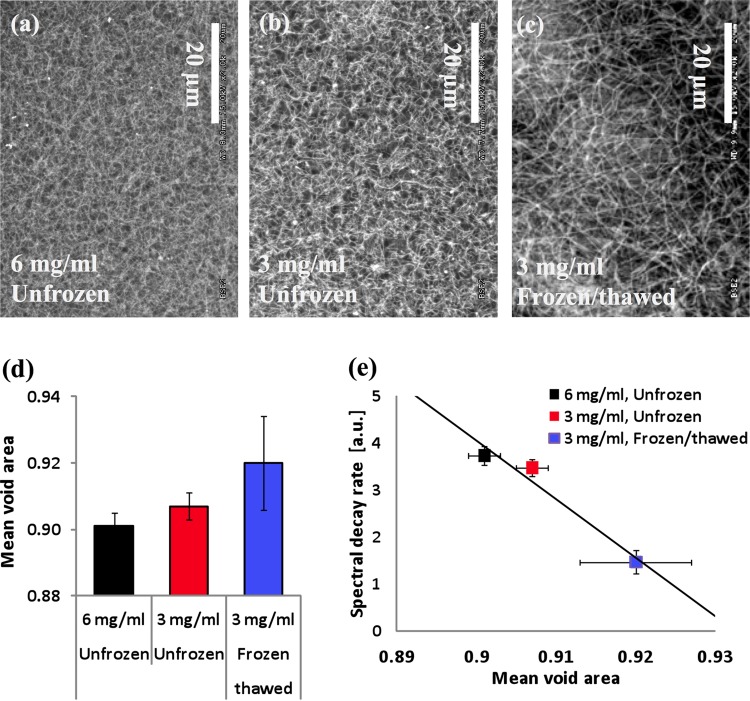
Fig. 3.
(a)–(c) Representative SEM images of the scaffold microstructures from unfrozen and frozen/thawed regions. (d) Comparison of mean void areas for each scaffold region. (e) Correlation between the mean void areas and the spectral decay rates β for three distinct cases. Error bar represents standard deviations (n ≥ 3 for all data points).

