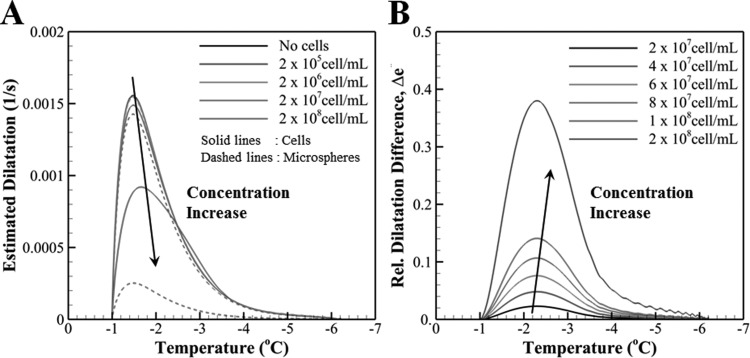
Fig. 10.
(a) The variation of estimated freezing-induced dilatation with decreasing temperature for different concentrations of cells and microspheres. Solid lines correspond to ETs with cells while dashed lines correspond to ETs with microspheres. (b) The variation of relative difference of freezing-induced dilatation between the cells versus microsphere ETs with decreasing temperature. Unlike the actual experimental settings, this analysis assumes the sphere diameter to be the same as the diameter of the MCF7 cells in order to isolate the effects of cellular water transport from differential size effects.

