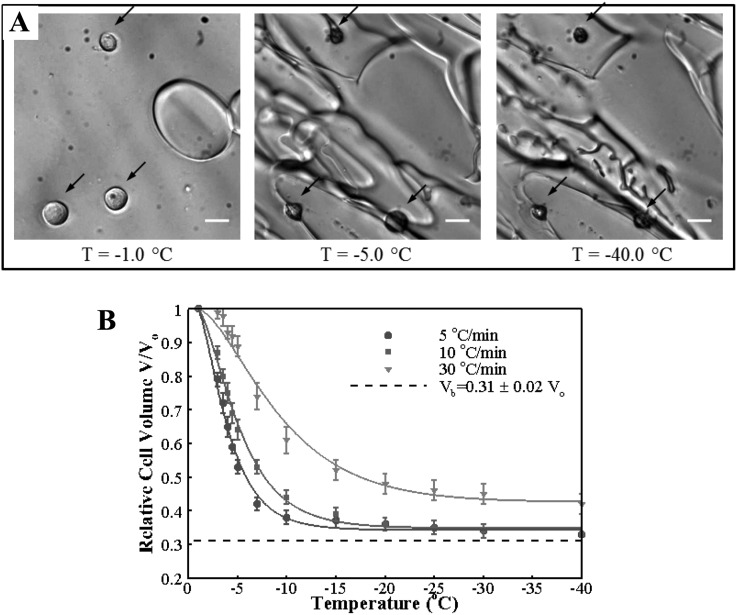
Fig. 7.
Cellular water transport during freezing. (a) Representative cryomicroscopy images of MCF7 cells dehydrating during freezing with the cooling rate of 10 °C/min. The locations of cells are indicated by dark arrows. Scale bar is 20 μm (b) change of cell volume with decreasing temperature for the three cooling rates. The error bars stand for the standard error of the mean. Solid lines are model predictions with the optimal membrane permeability parameters.

