
Figure 1.
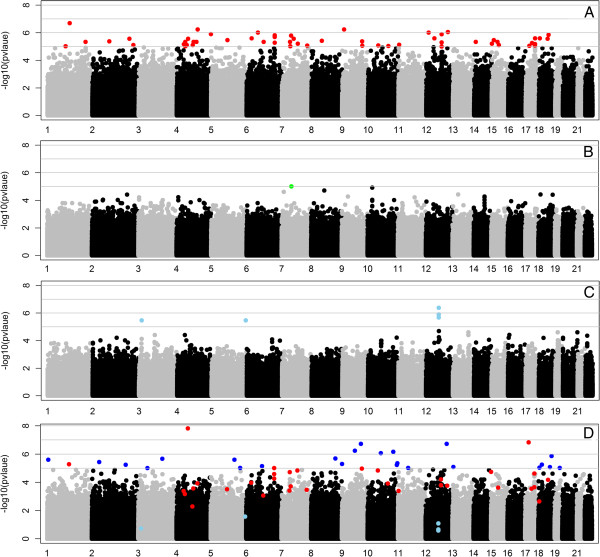
Manhattan plots of the trans-ancestral analysis. (A) European-American, (B) African-American, (C) Hispanic-American population, and (D) all three populations combined. The y-axis displays the negative logarithm of the p value for each SNP marker; the x-axis displays the markers’ genomic coordinates by chromosome. In (A), (B), and (C), colored dots (red for European-Americans, green for African-Americans, and light blue for Hispanic-Americans) indicate markers with p value <1 × 10⁻⁵. Among these markers, those that passed inclusion criteria in the mega-sample are also indicated with their respective colors in (D), where the additional markers with p value <1 × 10⁻⁵ in the mega-analysis are indicated in blue.