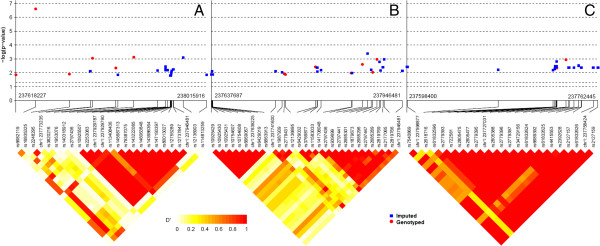
Figure 2.
The p value and LD plot of post-imputation RYR2 SNPs for each population. Trans-ancestral analysis of genotyped and imputed association results and LD of the top 1% SNPs of RYR2 after imputation. (A) European-American population, (B) African-American population, and (C) Hispanic-American population.

