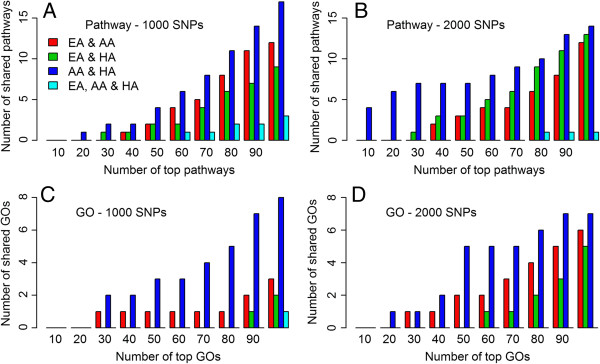
Figure 3.

Overlap of genetic risk factor for childhood asthma across the three populations: At the pathway and GO level. The number of shared pathways (y-axis) among different numbers of top-ranked pathways (x-axis) when the top (A) 1,000 and (B) 2,000 SNPs were declared as noteworthy. The number of shared GO terms (y-axis) among different numbers of top-ranked GO terms (x-axis) when the top (C) 1,000 and (D) 2,000 SNPs were declared as noteworthy. EA, European-American; AA, African-American; HA, Hispanic-American populations.
