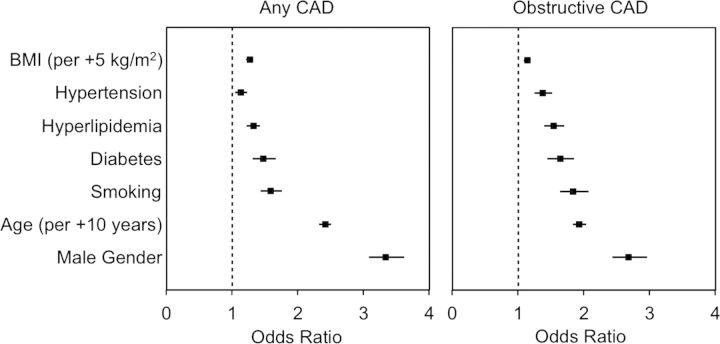
Figure 1.
Variables independently associated with the presence of any CAD and obstructive CAD. These represent the adjusted odds ratios (boxes) and 95% confidence intervals (horizontal lines) for each of the risk factors in the models. An increased BMI (per +5 kg/m2) was independently associated with a greater presence of any CAD (P < 0.001) and obstructive CAD (P < 0.001). Obstructive CAD is defined as the presence of any stenosis ≥50% in diameter. BMI, body mass index; CAD, coronary artery disease.

