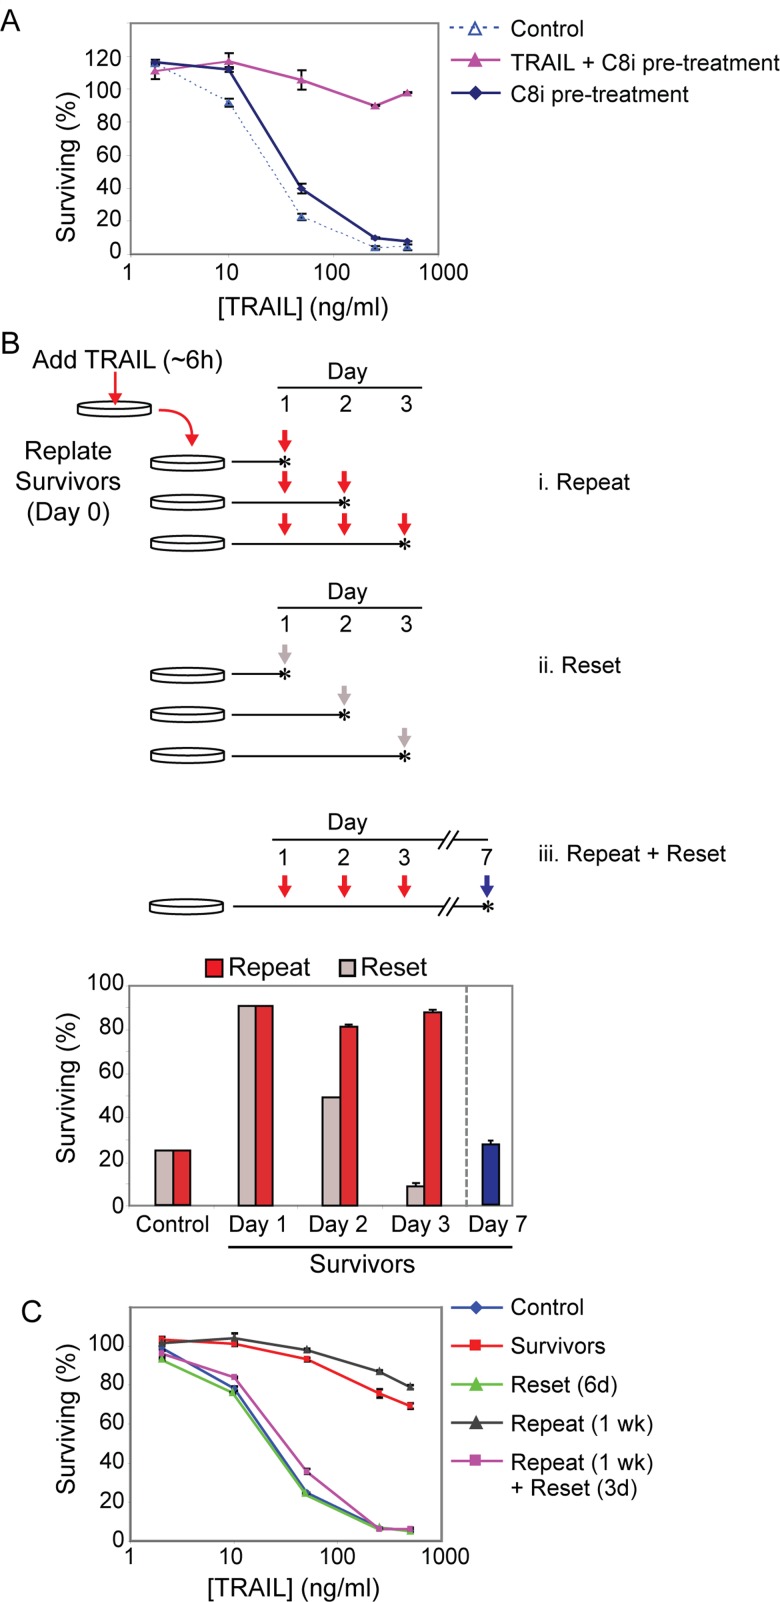
FIGURE 3:
Reversible resistance is induced even in the absence of cell death and is sustained by periodic TRAIL treatments. (A) Cell viability assay showing the sensitivity of control cells, cells pretreated for 18 h with TRAIL (50 ng/ml) + caspase-8 inhibitor (25 μM), or cells pretreated for 18 h with caspase inhibitor alone to a subsequent 6-h treatment with the indicated doses of TRAIL (after wash-off of the initial treatment). (B) Plot showing percentage of surviving (cleaved PARP-negative) cells after TRAIL (50 ng/ml for 6 h) treatment in a “repeat” experiment (i, red arrows and red bars), or in a parallel “reset” experiment (ii, gray arrows and gray bars). The plot shows the percentage of surviving control and day 1 survivor cells after TRAIL treatment for both experiments, followed by percentage of surviving cells after “retreatment” (50 ng/ml TRAIL for 6 h) on consecutive days as shown in the schematic (red scheme) or after allowing cells to “reset” for the number of days indicated before the final treatment (gray scheme). iii, Percentage of surviving (cleaved PARP-negative) cells after TRAIL (50 ng/ml for 6 h) treatment of cells allowed to recover for 4 additional days after three successive “repeat” treatments (blue arrow and blue bar). Vertical arrows in the schematic represent treatments (50 ng/ml TRAIL for 6 h), and stars represent collection times after treatment. Data are mean ± SE of triplicate samples. (C) Cell viability plot of the percentage of surviving control, survivors (day 1), reset (day 6), repeat (treated daily for 1 wk with 50 ng/ml for 6 h), and repeat + reset (treated daily for 1 wk with 50 ng/ml for 6 h and then allowed to recover for 3 d in the absence of TRAIL) MCF10A cells after a 6-h TRAIL (50 ng/ml) treatment.

