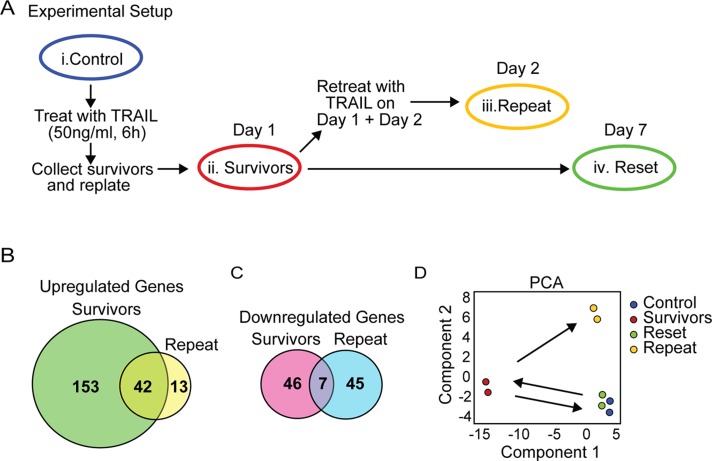
FIGURE 4:
Microarray analysis reveals distinct gene expression profiles for survivors and repeat cells, but control and reset cells cluster together. (A) Experimental setup for RNA collection from control (i), survivors (ii), repeat (iii), and reset cells (iv). (B) Venn diagram of genes significantly up-regulated in survivor and repeat cells compared with control cells. (C) Venn Diagram of genes down-regulated in survivor and repeat cells compared with control cells. (D) Principal components analysis of the gene expression data. Groups (representing duplicate samples) are plotted along the two components that account for the most variation (74.7%) in the data. The first component represents genes that differ most between control and survivor cells; the second component represents genes that differ most between control and repeat cells.

