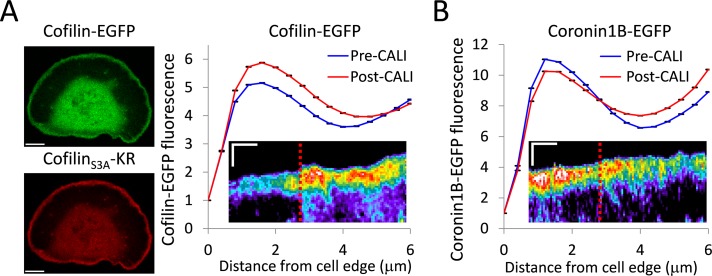
FIGURE 5:
CofilinS3A outcompetes wild-type cofilin for lamellipodia localization. (A) Left, coexpression of cofilin-EGFP and cofilinS3A-KR. Scale bars, 10 μm. Right, graph depicting the average leading edge profile of cofilin-EGFP before and after CALI of cofilinS3A-KR (n = 7 cells). After CALI, there is a significant increase in cofilin-EGFP fluorescence. Error bars represent 95% confidence intervals. The graph inset shows a representative kymograph of cofilin-EGFP from a cofilinS3A-KR CALI experiment. (B) Cells were cotransfected with coronin1B-EGFP and cofilinS3A-KR. The graph depicts average leading-edge profile of coronin1B-EGFP before and after CALI of cofilinS3A-KR (n = 6 cells). After CALI, there is a significant loss of coronin1B-EGFP fluorescence from the leading edge. Error bars represent 95% confidence intervals. The inset shows a representative kymograph of coronin1B-EGFP from a cofilinS3A-KR CALI experiment. Kymographs are pseudocolored to emphasize changes in fluorescence intensity. Time of CALI is indicated with a dotted red line. Kymograph scale bars, 3 μm (vertical) and 3 min (horizontal).

