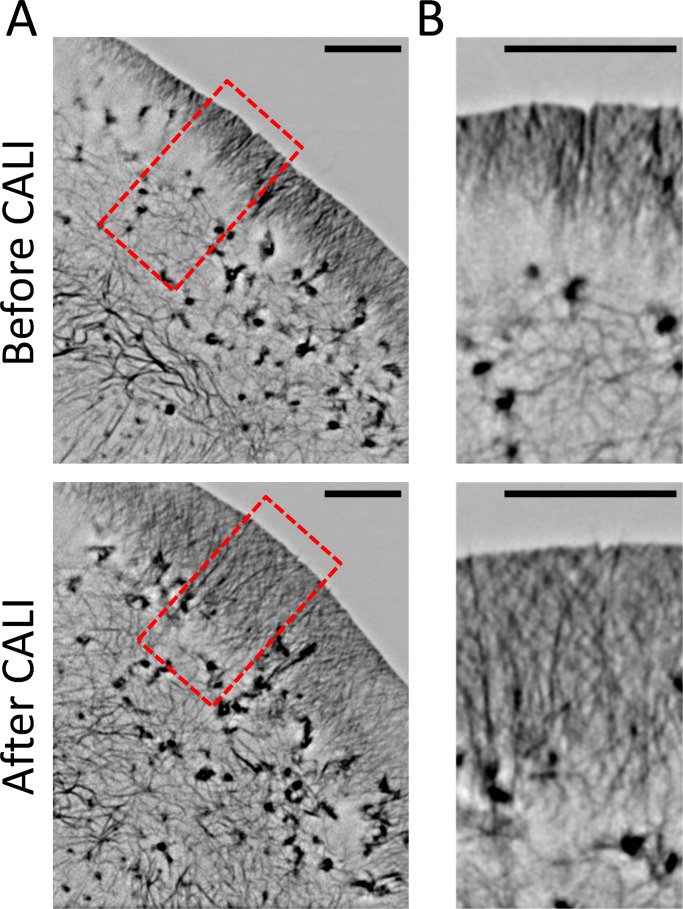
FIGURE 7:
Live-cell superresolution imaging of actin demonstrates an increase in lamellipodial F-actin after CALI of cofilin. (A) Representative images of Lifeact-EGFP before and after CALI of cofilin-KR in cofilin-KD cells taken with 3D-SIM imaging. (B) Close-up images of the region indicated by the red box in A. After CALI, the lamellipodia significantly extended inward and displayed numerous long filaments interspersed throughout. Scale bars, 5 μm.

