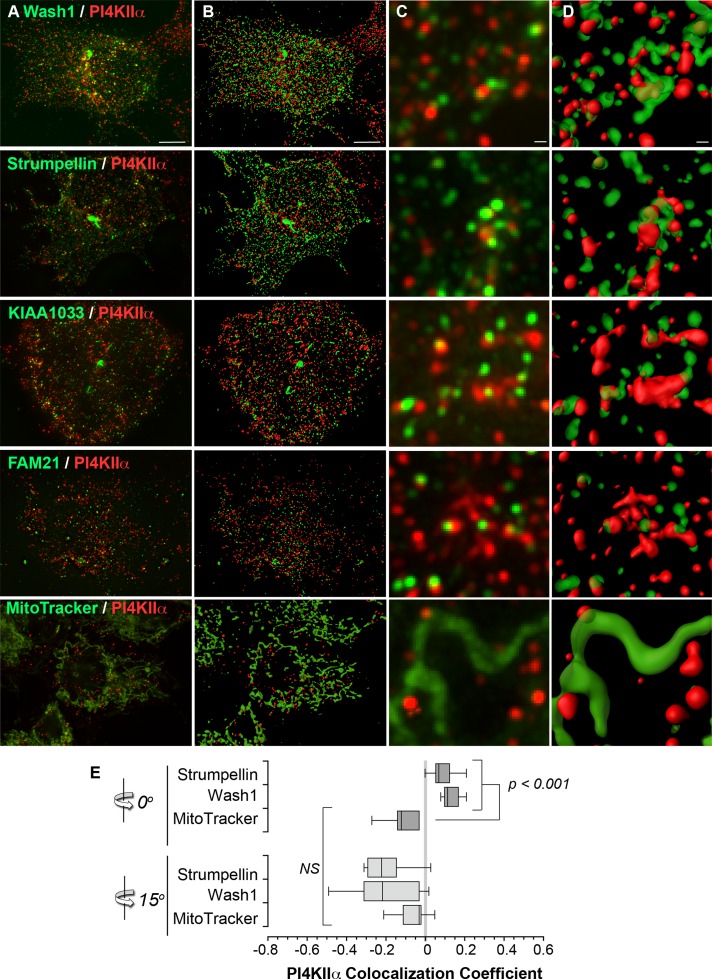
FIGURE 5:
PI4KIIα colocalizes with the WASH complex. (A, C) HEK293T cells were either transiently transfected with EGFP-tagged subunits of the WASH complex or stained with MitoTracker green, fixed, and processed for indirect immunofluorescence microscopy. Images were acquired by high-resolution deconvolution microscopy. The z-stack projections are shown. (B, D) Isosurface renderings of the z-stack data created using Imaris software. (E) Calculation of Pearson's correlation coefficient between signal intensities of strumpellin-EGFP, WASH-EGFP, or MitoTracker and endogenous PI4KIIα. Correlation was lost when one channel was rotated by 15°. Here n = 6 for WASH-EGFP, n = 7 for strumpellin-EGFP, and n = 9 for MitoTracker-A488. Statistical comparisons were performed by nonparametric analysis using a group Kruskal–Wallis rank sum test followed by individual Wilcoxon–Mann–Whitney rank sum tests.

