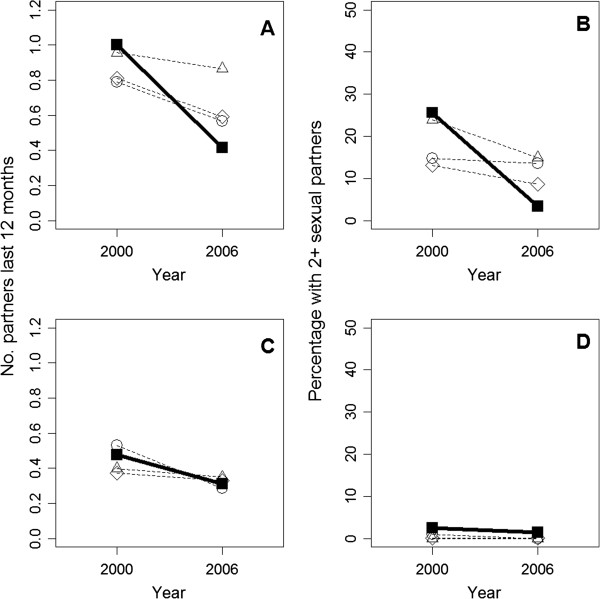
Figure 1.

Changes from 2000 to 2006/2007 for conservancy residents (filled squares, solid line) versus 3 comparison groups (dashed lines, circles = quasi-experimental match; triangles = nearest geographical cluster; diamonds = entire non-conservancy population) for mean number of sexual partners over the last 12 months in (A) men and (C) women, and mean percentage having two or more sexual partners in the last 12 months in (B) men and (D) women.
