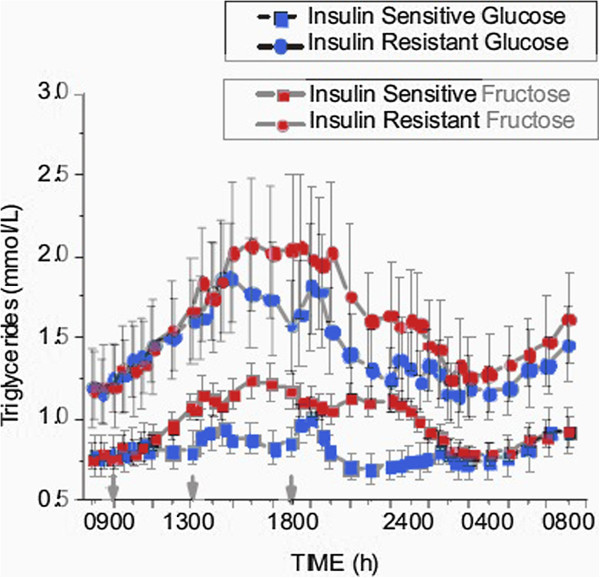
Figure 6.
Comparative effects of fructose-sweetened (red) and glucose-sweetened beverages (blue). Data from Teff, et al. [5] were merged. Insulin-sensitive (−□-) and insulin-resistant (−○-) sub-groups were separately analyzed from the original populations.

