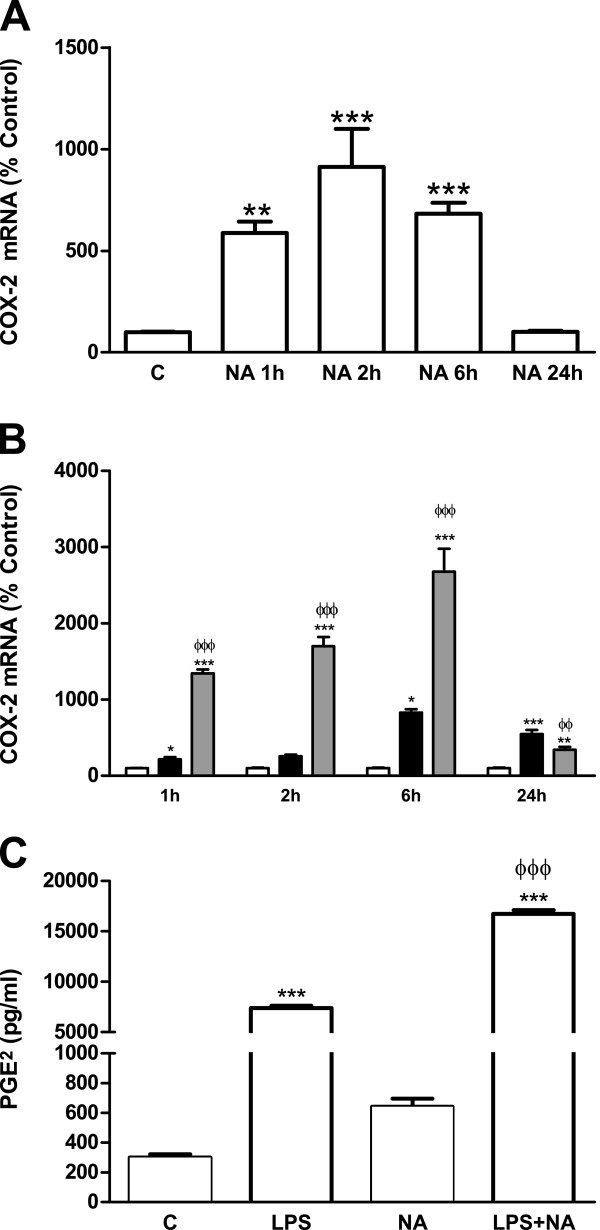
Figure 7.
NA effects on COX-2 and PGE2. (A) Astrocytes were incubated with control media or NA 10 μM for 1, 2, 6 or 24 hours. RNA was isolated and mRNA levels of COX-2 were determined by RT-PCR. Data are expressed as percentage of control values (set to 100%). **P <0.01 versus control; ***P <0.001 versus control. Data are means ± SE of n = 8 replicates per group. (B) Astrocytes were incubated with control media (white columns), LPS 0.1 μg/ml (black columns) or LPS and NA 10 μM (gray columns) for 1, 2, 6 or 24 hours. RNA was isolated and COX-2 mRNA levels determined by RT-PCR. Data are expressed as percentage of control values (set to 100%). *P <0.05 versus control; **P <0.01 versus control; ***P <0.001 versus control; ΦΦP <0.01 versus LPS; ΦΦΦP <0.001 versus LPS. Data are means ± SE of n = 8 replicates per group. (C) Astrocytes were incubated with control media, LPS 0.1 μg/ml, NA 10 μM, or LPS and NA for 24 hours. PGE2 levels in the media were assessed by EIA. ***P <0.001 versus control; ΦΦΦP <0.001 versus LPS 0.1 μg/ml. Data are means ± SE of n = 8 replicates per group. C, control; COX-2, cyclooxygenase-2; EIA, enzyme immunoassay; LPS, lipopolysaccharide; NA, noradrenaline; PGE2, prostaglandin E2; RT-PCR, reverse transcription polymerase chain reaction; SE, standard error.

