
Figure 2.
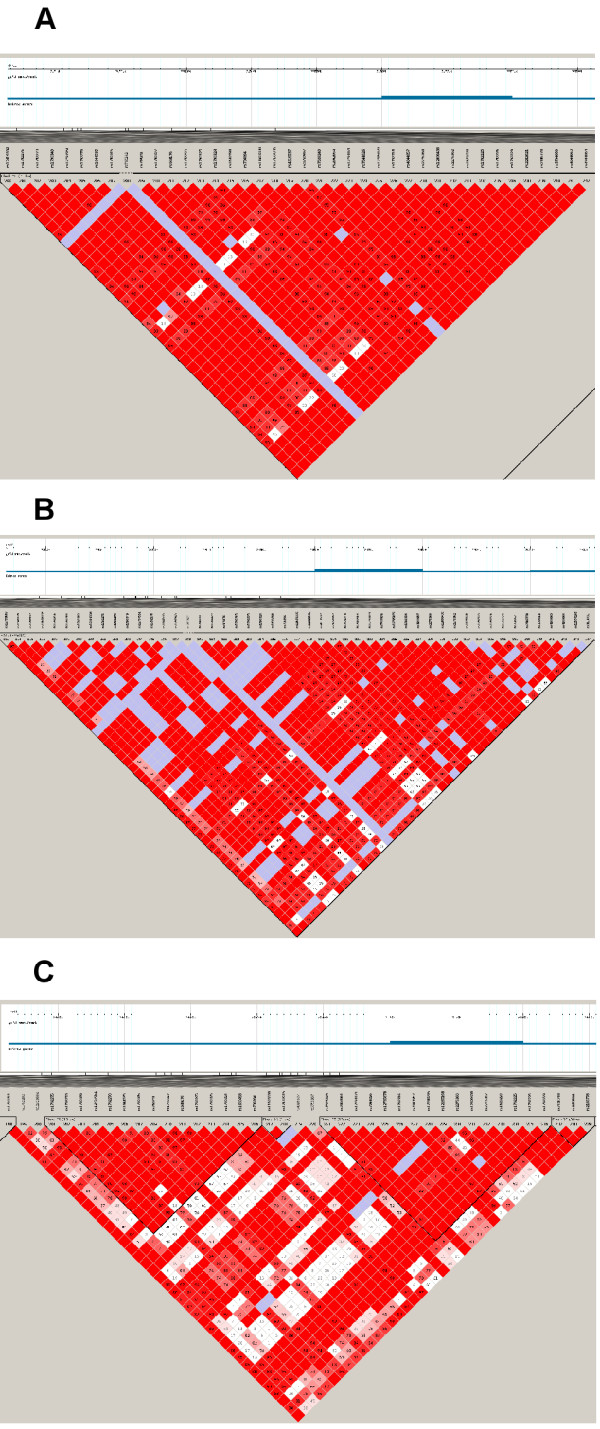
Linkage disequilibrium of SNPs in and around DHCR7 and NADSYN1 for A) JPT + CHB, B) CEU and C) YRI. The numbers within each square indicate the D’ values. Squares are colour-coded as follows: white: D’ < 1, LOD < 2; blue: D’ = 1, LOD < 2; pink: D’ < 1, LOD ≥ 2; and bright red: D’ = 1, LOD ≥ 2.