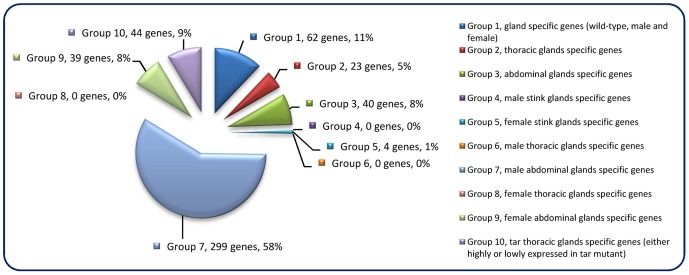
Figure 1. Odoriferous gland transcriptome screening result.
Each pie slice is indicated with the group name, the number of genes classified, and their percentage. Each group is signified as a specific non-overlapping subtraction group with each gene belonging to only one group. E.g. Group 1 consists of genes that are highly expressed in all glands but not specifically in one gland type or only in one sex.

