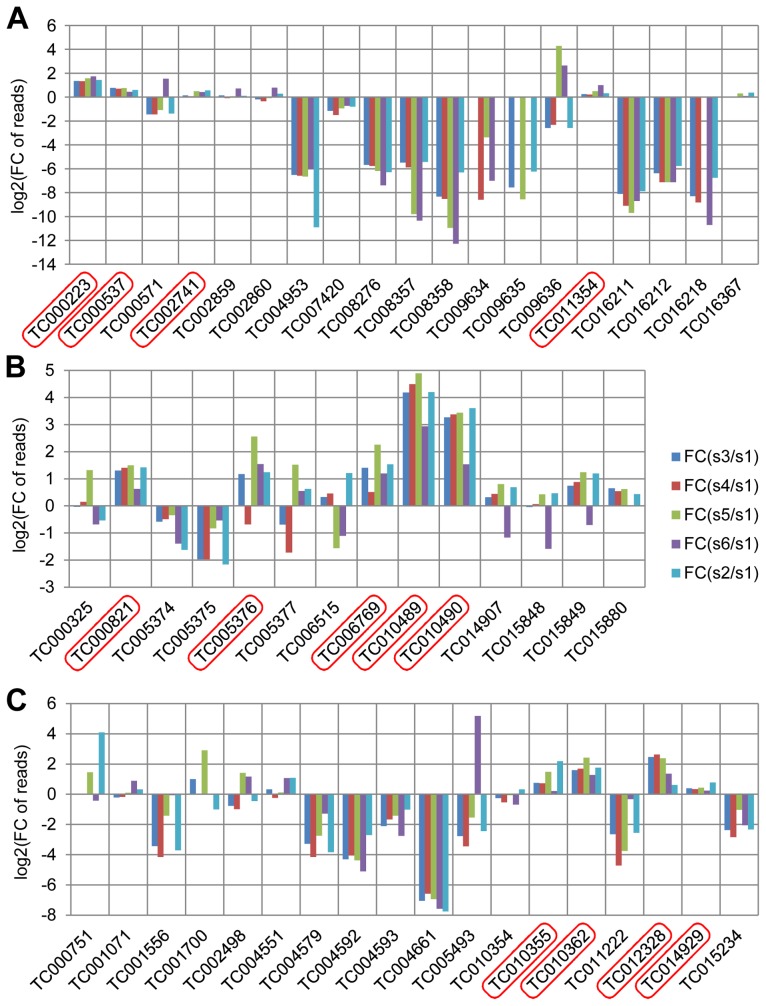
Figure 3. Annotated quinone synthesis-related genes and their relative gland transcriptome expression levels.
A, glucosidases, 19 genes; B, phenol oxidases, 14 genes; C, peroxidases, 18 genes were annotated. In all charts, along the X-axes the different genes are presented, while the Y-axes present log2[fold change of reads in glands against control]. Abbreviations: FC: fold change; s1: sample 1, anterior abdomen as a control; s3: sample 3, male prothoracic glands; s4: sample 4, female prothoracic glands; s5: sample 5, male abdominal glands; s6: sample 6, female abdominal glands; s2: sample 2, tar prothoracic glands. The genes with higher reads in gland samples are marked with red squares.

