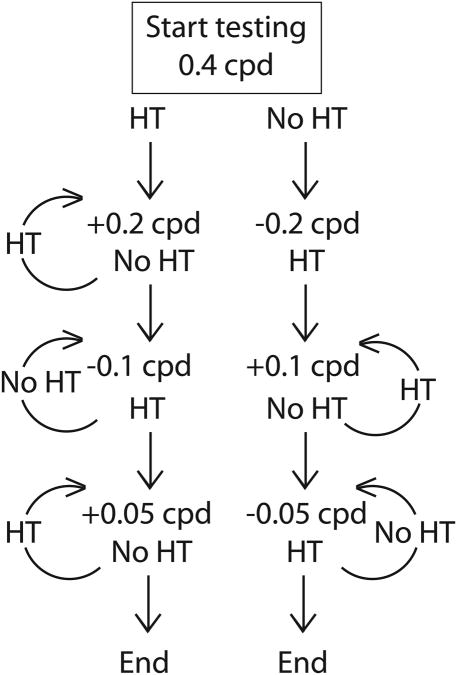
Figure 2.
A decision tree representing the order of presentation of spatial frequencies starting at 0.4 cpd. If head tracking (HT) occurs in response to the stimulus, frequency presented would be increased by 0.2 cpd to 0.6 cpd. If no head tracking (NoHT) occurs, it would be decreased by 0.2 cpd to 0.2 cpd. Depending on the outcome of each trial, the next spatial frequency is increased or decreased. Every reversal of tracking behavior caused the step for the following trial to be halved, and testing was complete when the next step required would be less than 0.05 cpd.

