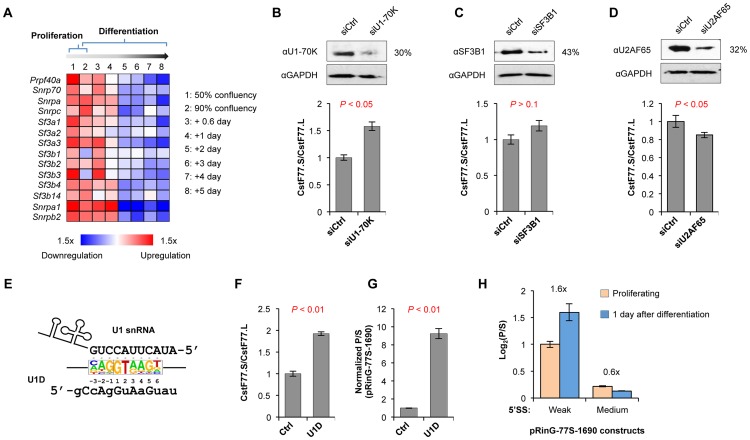
Figure 6. U1 snRNP regulates the usage of intronic pA of CstF-77 gene.
(A) Regulation of expression of factors in U1 and U2 snRNPs in C2C12 differentiation. Expression analysis was based on a microarray dataset from the GEO database (GSE11415). Expression changes are represented by colors based on the scale shown at the bottom of the graph. (B) Effect of knockdown of U1-70K on the CstF-77.S/CstF-77.L ratio. Top, Immunoblot (IB) showing knockdown efficiency; bottom, CstF-77.S/CstF-77.L ratio as measured by RT-qPCR. P-value (T-test) comparing knockdown and control siRNA samples is shown. (C) and (D) As in (B), except that knockdowns of SF3B1 (C) and U2AF65 (D) are shown. (E) Inhibition of U1 snRNP interaction with 5′SS by U1D oligo. Sequence of the 5′ region of U1 snRNA is shown. The consensus sequence of the 5′SS of all RefSeq-supported human introns is represented by a sequence logo. U1D sequence is also shown (locked nucleic acid (LNA) residues are in uppercase and 2′-OMe RNA residues are in lowercase, see Materials and Methods for detail). (F) Effect of U1D on the CstF-77.S/CstF-77.L ratio. (G) Effect of U1D on the (isoform P)/(isoform S) ratio for pRinG-77S-1690. (H) The (isoform P)/(isoform S) ratios for pRinG-77S-1690 vectors with weak or medium strength 5′SS in proliferating and differentiating (1 day of differentiation) cells. See Figure 2D for 5′SS sequences. The ratio of the log2(P/S) value from proliferating cells to that from differentiating cells is indicated, where P represents the abundance of isoform P and S the abundance of isoform S. The difference in log2(P/S) value (proliferating cells vs. differentiating cells) is statistically significant (P<0.05, T-test) for all two constructs.

