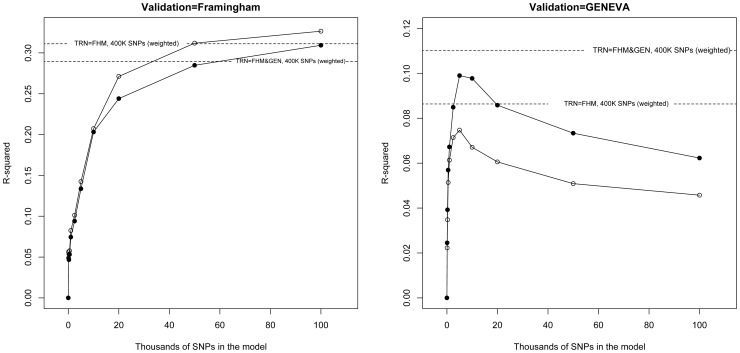
Figure 3. Prediction R2 (vertical axis) versus thousands of markers (selected based on p-values from the GWAS of the GIANT consortium, [5]) included in the model (horizontal axis) by validation data set (FHM in the left panel, GEN in the right panel) and training data set (line with dots training with FHM and GEN combined, line with circles, training-testing within each study).
Dotted horizontal lines give the prediction R2 obtained when all markers (p = 400,000) were used.

