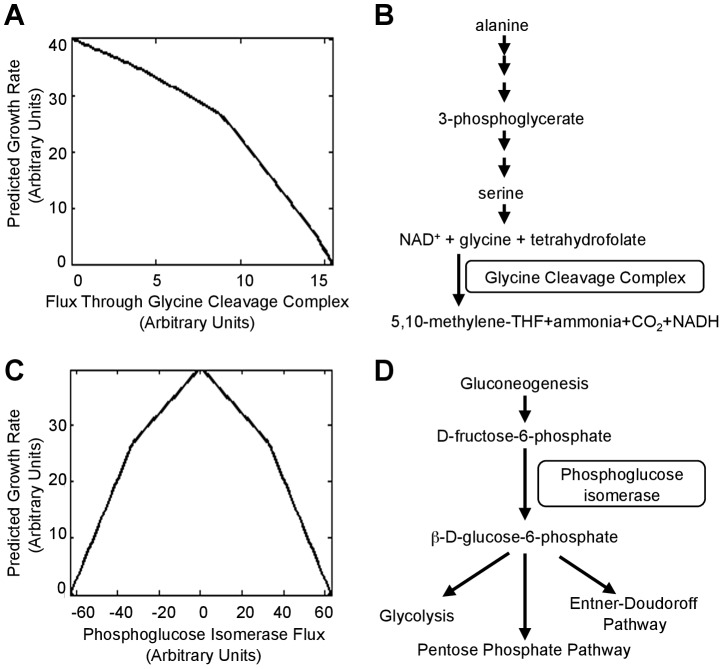
Figure 6. Deletions that move a cell towards the theoretically optimum flux distribution.
(A) Maximum growth rate of the iAF1260 flux balance analysis (FBA) model [27] on alanine as the sole carbon source when flux through the glycine cleavage complex is set to the indicated value. (B) The pathway shows a metabolic flux configuration capable of supporting low-levels of glycine degradation (less than ∼9 units in (A)) by the GCC. (C) Maximum simulated growth rate when flux through phosphoglucose isomerase is set to the indicated value. Positive fluxes (conversion of glucose to fructose) utilize a cycle where xylose isomerase, which is encoded by b3565, converts fructose back to glucose. To generate negative fluxes (fructose to glucose), the model runs gluconeogenesis and then degrades the glucose through the pentose phosphate pathway. (D) The reaction catalyzed by phosphoglucose isomerase connects the gluconeogenesis and glucose degradation pathways.

