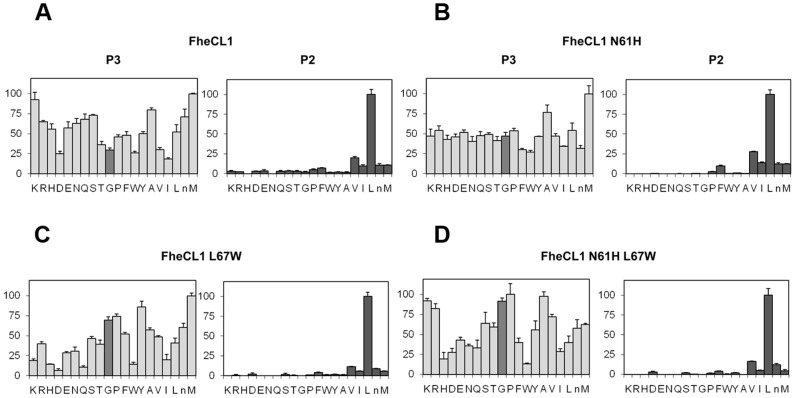
Figure 6. Profiling of the P2 and P3 substrate specificity of FheCL1 to FheCL3 enzyme variants using PS-SCL libraries.
The activity against the substrates is represented relative to the highest activity in each sub-library (hydrolysis rate for Leu and Met fixed peptide pools at P2 and P3, respectively, are taken as 100%), whereas the x axis shows the different amino acids using the one-letter code (n = norleucine). The bar corresponding to Gly is highlighted to assist visualization. Error bars display the standard deviation from triplicate experiments. (A) FheCL1, (B) FheCL1 N61H (C) FheCL1 L67W (D) FheCL1 N61H L67W.

