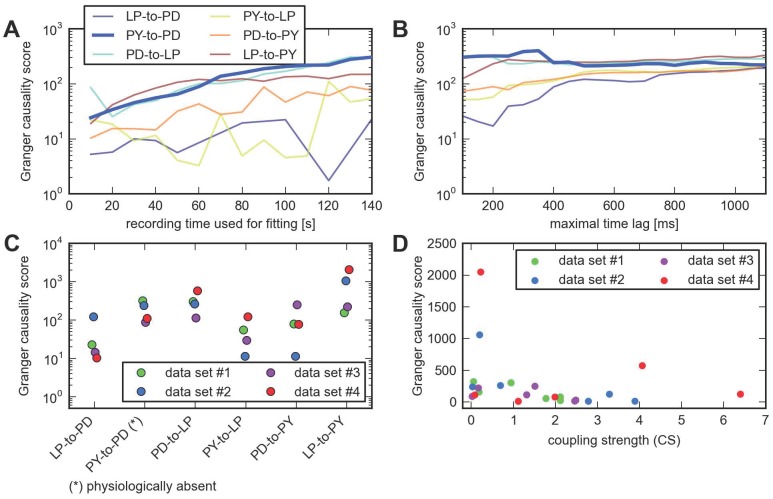
Figure 3. Using a Granger causality score with the point process model does not recover the physiological connectivity.
A, Granger causality (GC) scores as a function of time used for fitting. B, GC scores as a function of the maximal time lag used for fitting (same color scheme as in A). C, Network inference for all four data sets, using the Granger causality score. The physiologically nonexistent connection does not correspond to the weakest one in any case. Horizontal scatter is for visualization only. D, Coupling strengths (CS) and Granger causality scores (GC) are uncorrelated for the point process model. For the point process model, the strength of the coupling can be either defined by the net integral of the interaction filter (horizontal axis) or by the statistical Granger causality score (vertical axis). The scatter plot shows the six cross-couplings for each of the four data sets. The two measures of coupling strength are not significantly correlated ( ,
,  ).
).

